Why review accounts receivable KPIs weekly instead of monthly?
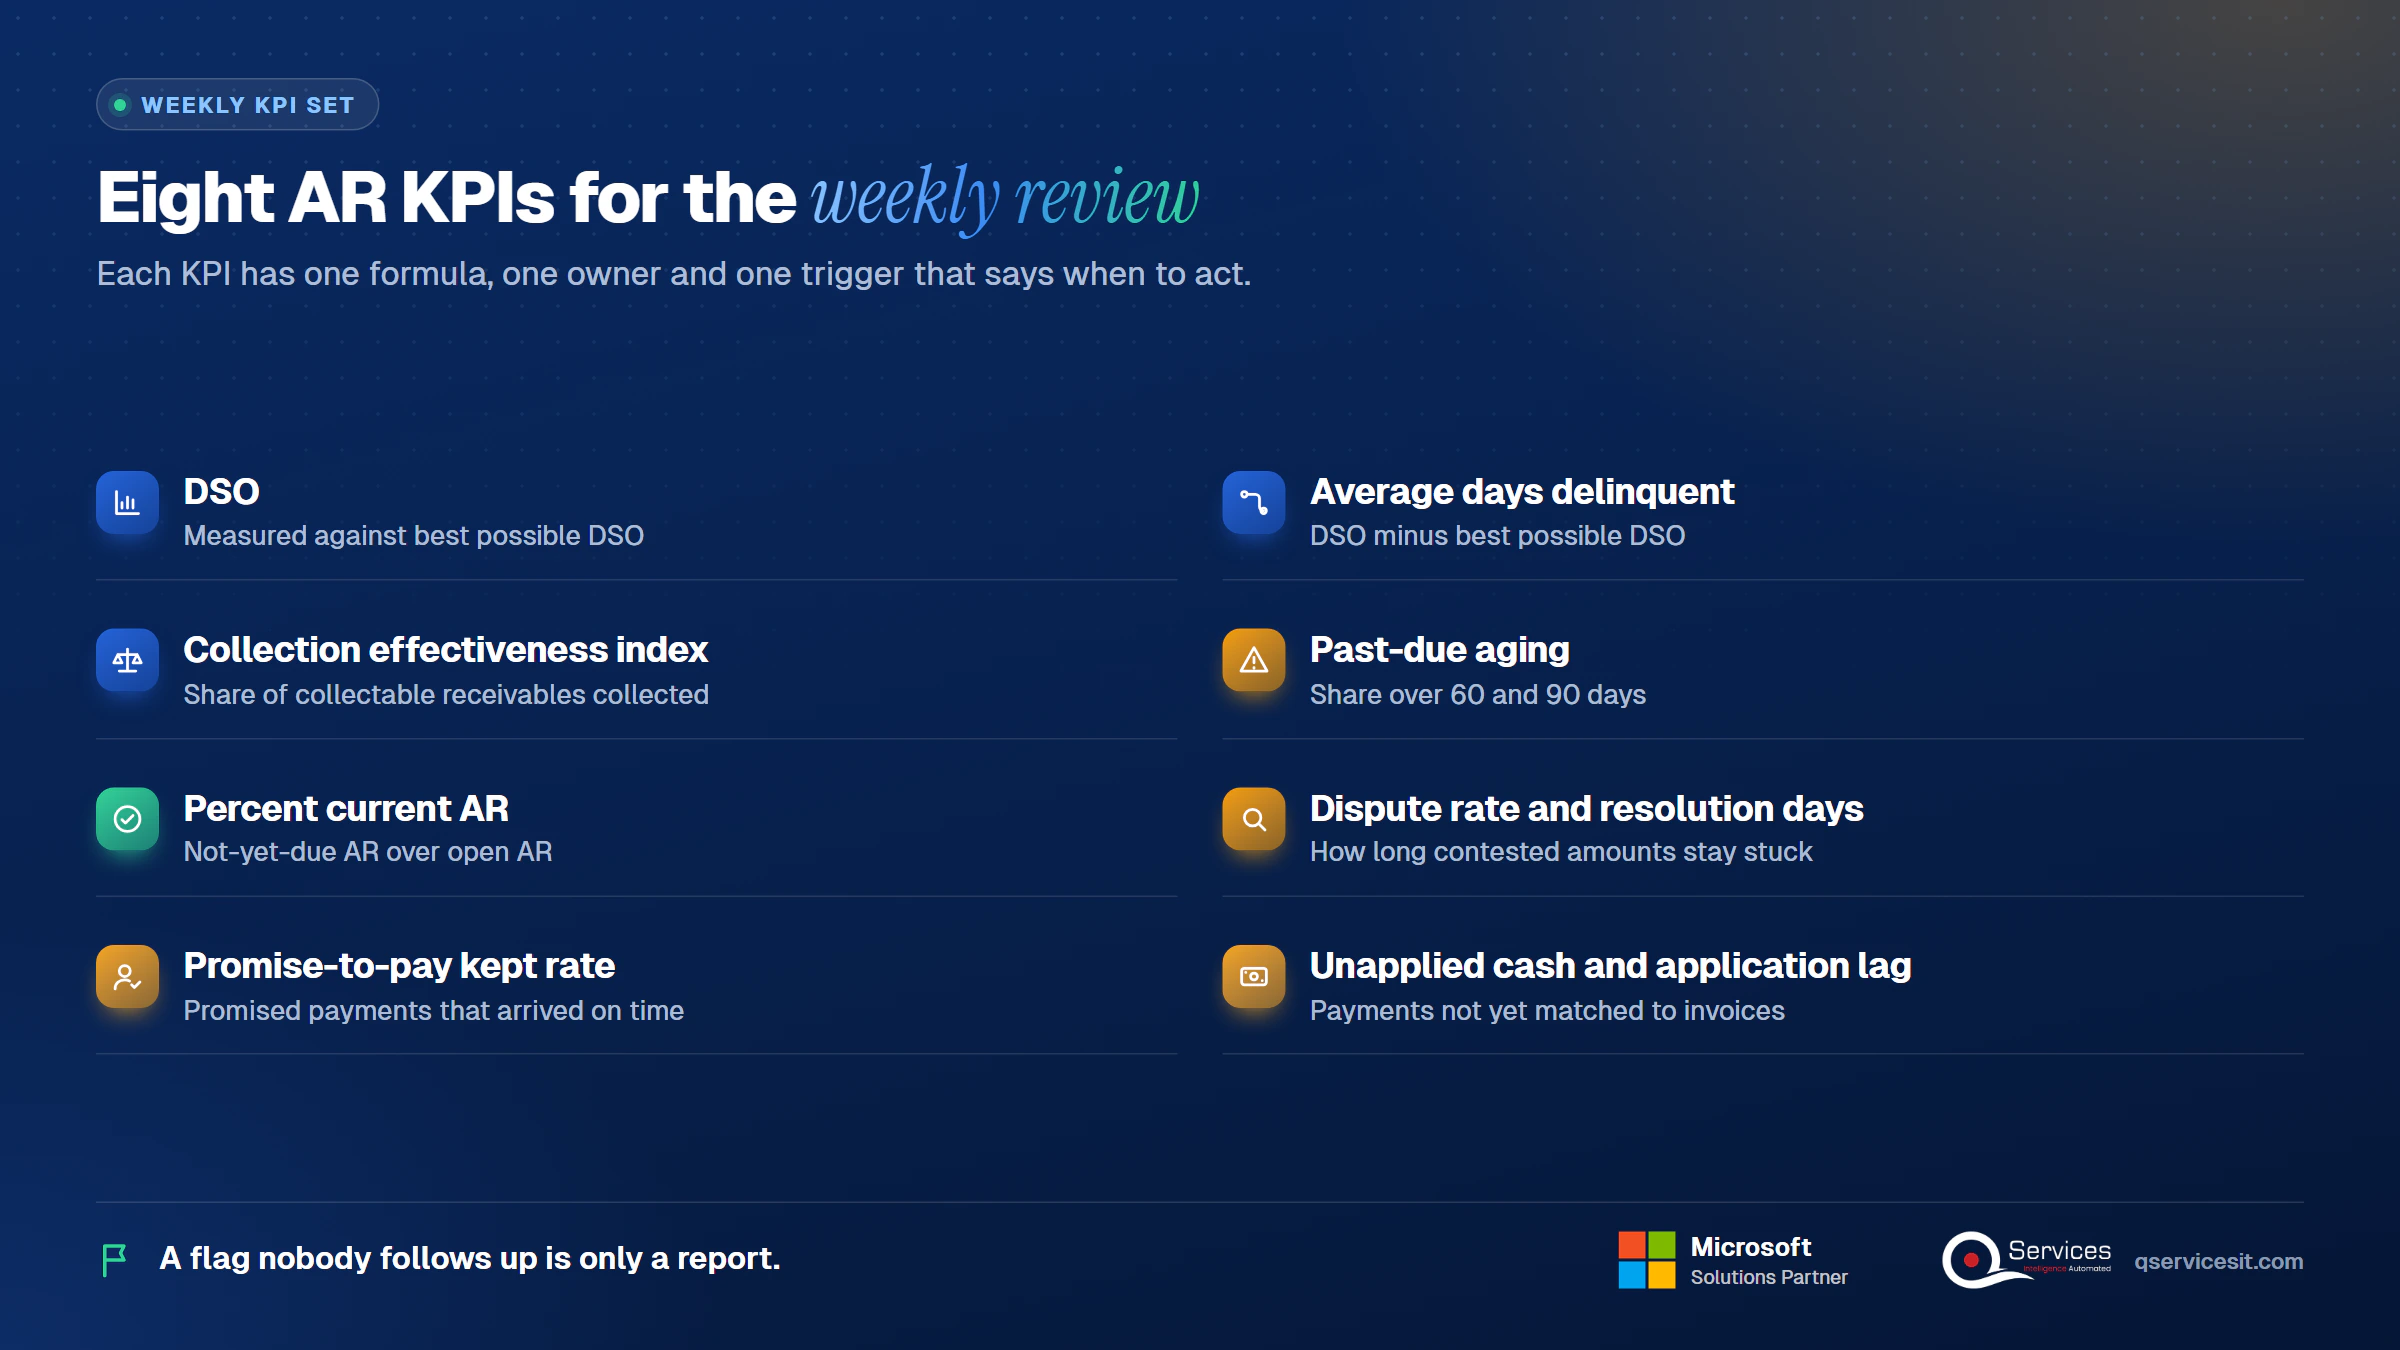
A controller should review eight accounts receivable KPIs every week: DSO, average days delinquent, collection effectiveness index, past-due aging, percent current, dispute rate, promise-to-pay kept rate, and unapplied cash. Each has one formula, one owner and one trigger that says when to act.
A monthly close shows you a problem after the cash is already late. A weekly look catches the one customer who slipped from 30 to 60 days while the average still looked fine. If you’re building the routine around accounts receivable automation, these eight are the numbers the agents should prepare before you sit down.
This guide reflects how we run the review as of November 2026. Every number comes from one worked ledger, so the formulas reconcile.
Which AR number would you check first on Monday?
Bring your current AR report to a short call and we’ll walk through which of the eight metrics your ERP can already show and which it can’t.
Quick Answer Accounts receivable KPIs a controller should review weekly are DSO, average days delinquent, collection effectiveness index, past-due aging, percent current, dispute rate, promise-to-pay kept rate and unapplied cash. Each is a formula run on the same ledger, with an owner and a trigger that says when to act. Review them in 30 minutes every Monday.
Which accounts receivable KPIs matter weekly?
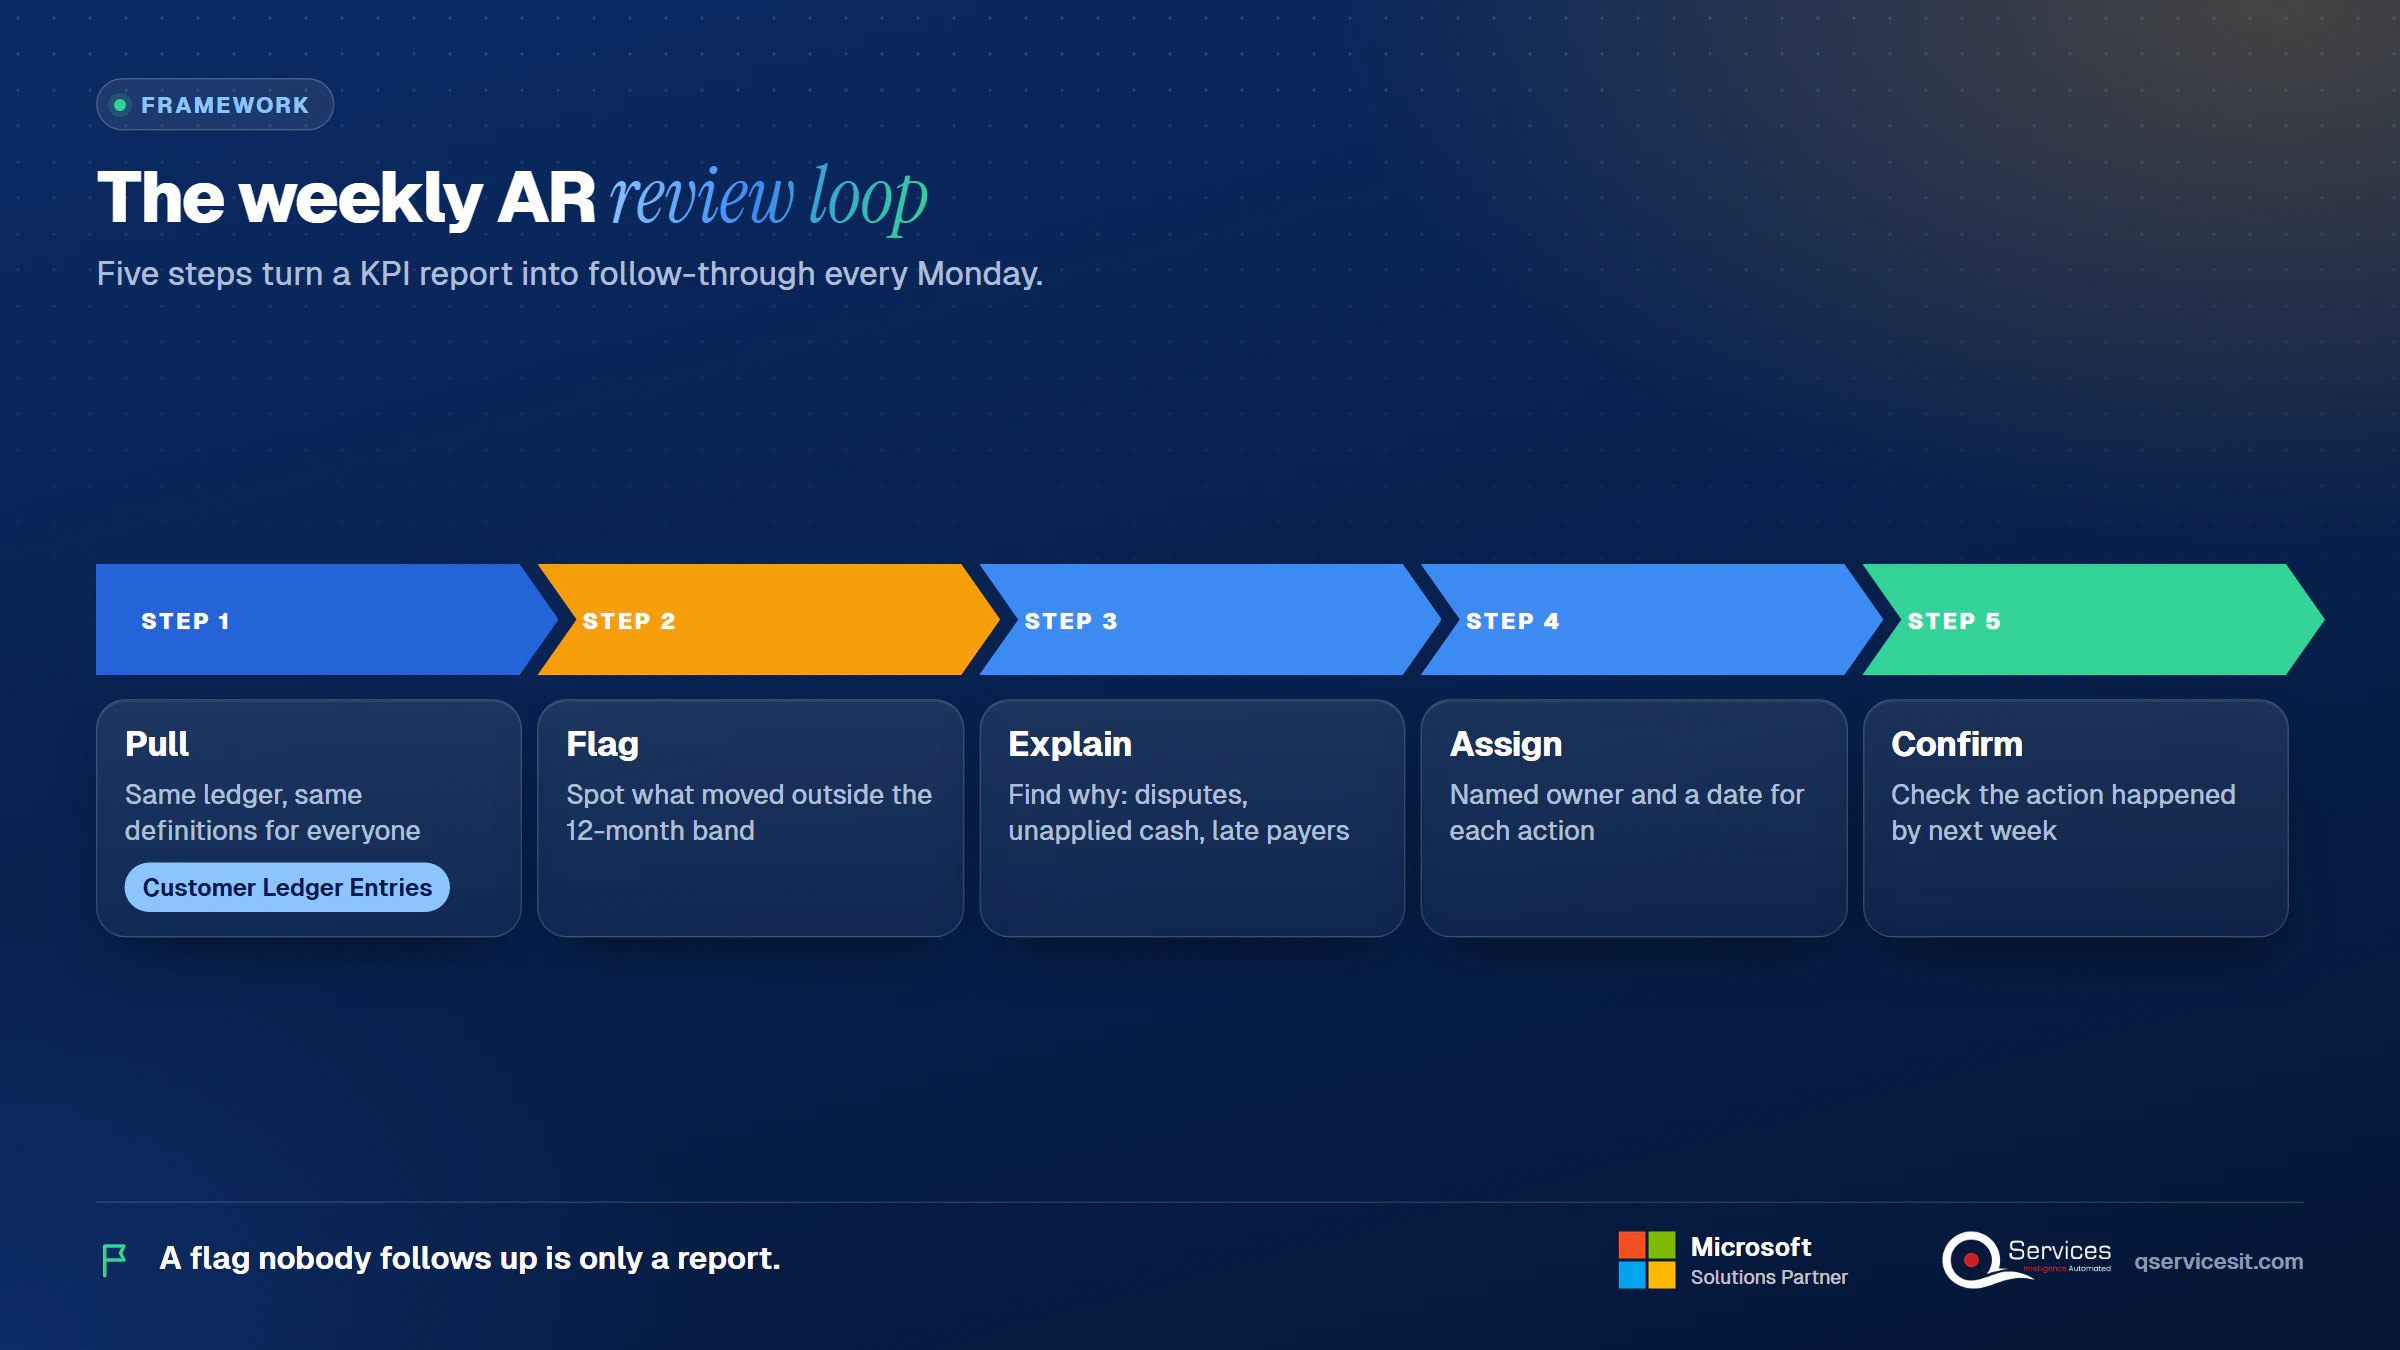
The right weekly set is small, and it’s ordered. You pull the numbers, flag what moved, explain why, assign an owner and confirm the action happened by next week. Most AR dashboards stop at the pull.
The QServices Framework Weekly AR Review = Pull → Flag → Explain → Assign → Confirm
Pull first so everyone argues about the same numbers. Confirm last, because a flag nobody follows up is only a report.
What are the 8 weekly AR KPIs for controllers?
These are the AR KPIs for controllers that earn a seat in a weekly review, in the order we read them:
- DSO, measured against best possible DSO
- Average days delinquent (ADD), which is DSO minus best possible DSO
- Collection effectiveness index (CEI)
- Past-due aging, with the share over 60 days and over 90 days
- Percent current AR
- Dispute rate and days to resolve disputes
- Promise-to-pay kept rate
- Unapplied cash and cash application lag, with the write-off ratio as a watch item
Which accounts receivable metrics are left out of the weekly set?
AR turnover is DSO restated, so it adds no new weekly action. Cost per collection and right-party-contact rate matter for staffing, but they move slowly. Put them on a monthly "also track" list, along with bad debt ratio, which we keep as a weekly watch item only when write-offs are rising.
What does the master table look like?
This is the table to pin above the AR team’s desk. The worked company has $4.2M of monthly credit sales and $6.1M of open AR, and the figures come from that ledger.
| KPI |
Formula |
Worked result |
Weekly red flag |
First action |
| DSO |
Open AR / credit sales x days |
6.1 / 4.2 x 30 = 43.6 days |
Up more than 2 days vs your 12-week range |
Read ADD to see if it’s late payers |
| ADD |
DSO minus best possible DSO |
43.6 – 30.7 = 12.9 days |
Gap widening two weeks running |
Pull the top 10 overdue |
| CEI |
See formula below |
68.4% |
Falls week on week |
Check collector activity |
| Past due over 60 |
61+ days past due / open AR |
0.45 / 6.1 = 7.4% |
Any rise |
Escalate named accounts |
| Percent current |
Not-yet-due AR / open AR |
4.3 / 6.1 = 70.5% |
Falls |
Check invoicing delays |
| Dispute rate |
Disputed AR / open AR |
0.21 / 6.1 = 3.4% |
Backlog grows |
Assign each dispute an owner |
| Promise kept rate |
Kept / promises due |
29 / 40 = 72.5% |
Below your baseline |
Re-contact broken promises |
| Unapplied cash |
Unapplied / open AR |
0.31 / 6.1 = 5.1% |
Items older than 5 days |
Match or request remittance |
Key Insight An average hides the problem. In this ledger DSO is 43.6 days, but only $0.18M, about 3% of open AR, is over 90 days, and that small slice is where the next write-off comes from.
How do DSO and best possible DSO work together?
Days sales outstanding is the average number of days it takes to turn a credit sale into cash. Pick one definition and never change it: open AR divided by credit sales for the period, multiplied by the days in that period. For the full formula variants, see our days sales outstanding formula guide.
How do you calculate DSO on a rolling window?
Use a 30-day window for the weekly view and a 90-day window to smooth out spikes. With $6.1M of open AR and $4.2M of credit sales in the last 30 days, DSO is 6.1 / 4.2 x 30 = 43.6 days. If the 90-day figure is $12.9M of credit sales, DSO is 6.1 / 12.9 x 90 = 42.6 days, and the two are close enough that nothing is distorted by one big month.
Don’t mix this with a count-back method on the same slide. The two give different answers, and the argument that follows wastes the meeting.
What is the best possible DSO formula?
Best possible DSO is the DSO you would have if every customer paid exactly on time. The best possible DSO formula uses only the current, not-yet-due balance: current AR / credit sales x days in period.
In our ledger, $4.3M of the $6.1M is not yet due. Best possible DSO is 4.3 / 4.2 x 30 = 30.7 days. A target DSO equal to best possible DSO is unrealistic, because some invoices are always mid-term. The useful number is the gap.
What is average days delinquent?
Average days delinquent is DSO minus best possible DSO, so 43.6 – 30.7 = 12.9 days. It isolates lateness from payment terms.
A widening gap can signal weaker collections even when DSO looks flat, for example when terms were lengthened at the same time. That is why ADD gets its own line in the weekly pack.
How do you calculate collection effectiveness index?
Collection effectiveness index measures the share of collectable receivables you actually collected in the period. It reads 100% when everything collectable was collected.
What is the correct CEI formula?
The standard form, as described by AccountingTools, is:
CEI = (beginning receivables + credit sales – ending total receivables) / (beginning receivables + credit sales – ending current receivables) x 100
On our ledger: beginning receivables $5.8M, credit sales $4.2M, ending total $6.1M, ending current $4.3M. The numerator is 5.8 + 4.2 – 6.1 = 3.9. The denominator is 5.8 + 4.2 – 4.3 = 5.7. CEI is 3.9 / 5.7 = 68.4%.
The common error is using total receivables in both places, which makes the number look better than it is. For how to calculate collection effectiveness index across several periods and why it catches what DSO misses, read collection effectiveness index vs DSO.
What are the limits of CEI?
CEI ignores aging, doesn’t separate write-offs from payments, looks backward and covers credit sales only. Sources also disagree on what counts as current, and some use 60 days or fewer. Set your own definition once and write it on the report.
What do aging over 60 days and unapplied cash tell you?
These two metrics explain most surprises in DSO. Aging tells you who is late. Unapplied cash tells you whether the ledger is even telling the truth.
What is a sensible aging over 60 days target?
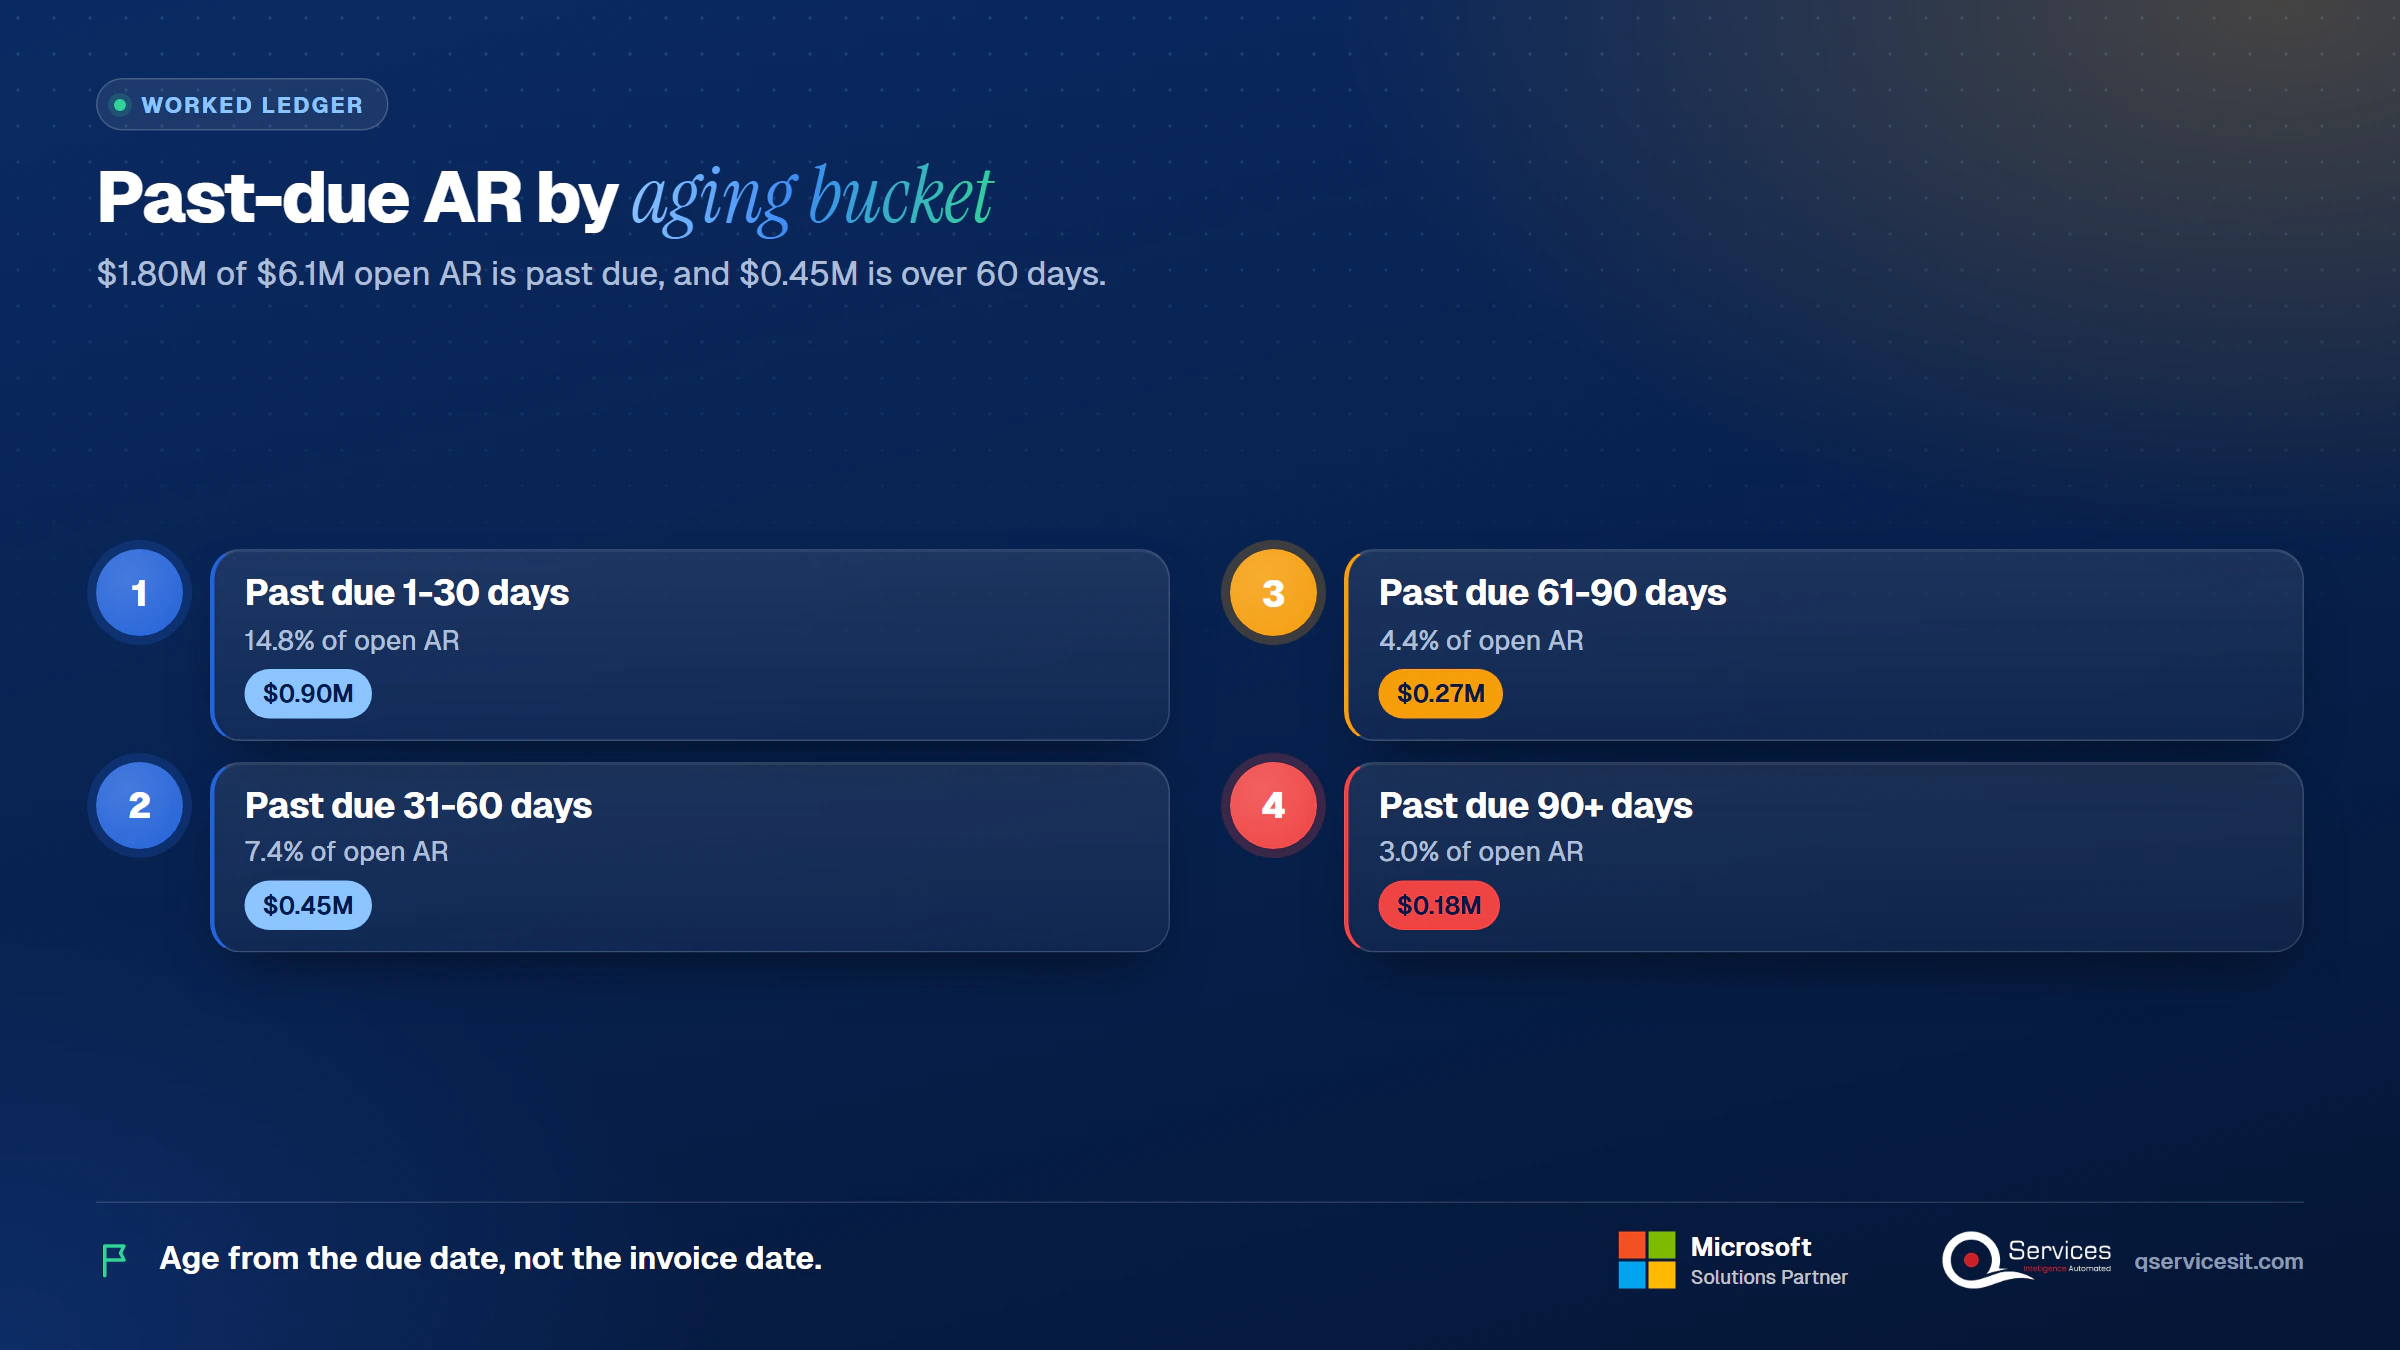
No standards body defines the aging over 60 days target, so it is a house metric: AR 61 or more days past due divided by total open AR. In our ledger it’s 0.27 + 0.18 = 0.45, or 7.4%. Age from the due date, not the invoice date, and tag disputed items so they aren’t dunned like ordinary late invoices. Our AR aging report guide shows how to read each bucket.
| Past-due bucket |
Amount |
Share of open AR |
| 1-30 days |
$0.90M |
14.8% |
| 31-60 days |
$0.45M |
7.4% |
| 61-90 days |
$0.27M |
4.4% |
| 90+ days |
$0.18M |
3.0% |
| Total past due |
$1.80M |
29.5% |
What is percent current AR?
Percent current is not-yet-due AR over total open AR: 4.3 / 6.1 = 70.5%. It’s the simplest early warning, because it falls before the older buckets rise. If it drops while sales are flat, look at late invoicing before you blame customers.
How do you track unapplied cash as a percentage of receivables?
Unapplied cash as a percentage of receivables is unapplied payments divided by open AR: 0.31 / 6.1 = 5.1%. Track the oldest item’s age too, which is your cash application lag.
Unapplied cash inflates DSO. A customer who paid 45 days ago can look both current and 61-90 days past due. Apply the $0.31M and open AR drops to $5.79M, so DSO falls from 43.6 to 41.4 days with no collections work at all. Our guide to clearing unapplied cash covers the backlog.
Key Insight Before you chase a customer on a 61-90 day invoice, check the unapplied list. In our worked ledger, unapplied cash alone moves DSO by 2.2 days.
What are dispute days and deduction days in AR?
Dispute days and deduction days in AR measure how long a contested amount stays stuck. They matter because disputed invoices can’t be collected, and standard dunning on them annoys the customer.
How do you measure dispute rate and resolution days?
Track three numbers. Dispute rate is disputed AR over open AR, here 0.21 / 6.1 = 3.4%. Resolution days is total days to resolve closed disputes divided by the number closed: 96 days across 12 closed disputes is 8 days. Resolution rate is closed over opened, so 12 closed against 15 opened is 80%, which means the backlog is growing.
If you see recurring short payments, a short pay tracking guide helps tag the reason codes.
What about deduction days and the promise-to-pay rate?
Deduction days outstanding is the same idea applied to customer deductions. Vendor sources quote conflicting benchmarks for it, so quote none and build your own baseline.
Promise-to-pay kept rate is the share of promised payments that arrived by the promised date. In our ledger 29 of 40 promises were kept, so 72.5% were kept and 27.5% were broken. It tells you whether your collectors’ follow-up is working, and none of the three pages that rank for this topic covers it. A broken promise needs a call within a day, so pair it with a dunning sequence.
Is aging over 60 days quietly growing in your ledger?
Book a call to see how an approval-first agent can flag stale invoices and unapplied cash, while your team approves anything that posts money.
How do you set targets without a benchmark?
Set targets from your own payment terms and your own history. Published averages conflict on definitions, such as ending versus average AR and credit sales versus total revenue, so treat them as context only. Don’t repeat the 45-day rule as fact. We haven’t found a source that proves it for your industry.
What baseline should you use?
Pull 12 months of weekly values for each KPI. Use the median as the baseline and the range as the normal band. A red flag is a move outside that band, or a trend in one direction for three weeks.
How do you handle seasonality?
Compare with the same weeks last year as well as the last four weeks. A distributor that bills heavily in Q4 will see DSO and percent current swing for reasons that aren’t collections problems.
| Cadence |
KPIs |
Owner |
Purpose |
| Weekly |
All 8 |
AR manager |
Act on what moved |
| Monthly |
Trend lines, write-off ratio, cost per collection |
Controller |
Spot drift, staffing |
| Quarterly |
Targets, terms, credit limits |
CFO and controller |
Reset baselines |
Where does each KPI live in Business Central?
For Dynamics 365 Business Central, the data comes from a few places. Business Central offers an Aged Receivables (Back Dating) report with customizable buckets by document, due or posting date, an Average Collection Period Power BI report, Data Analysis on Customer Ledger Entries, and a Reminder report.
Standards & References
| KPI |
Business Central source |
Usual pitfall |
| DSO and ADD |
Customer Ledger Entries, plus the Average Collection Period Power BI report |
Unapplied payments leave invoices open |
| CEI |
Customer Ledger Entries by posting and due date |
Posting date versus due date mix-ups |
| Aging, percent current |
Aged Receivables (Back Dating) |
Bucketing by posting date, not due date |
| Disputes |
Customer Ledger Entries with an on-hold marker or a dispute code |
Disputed items still dunned |
| Promise to pay |
Notes or a custom field on the ledger entry |
Not captured unless you add it |
| Unapplied cash |
Open payment entries in Customer Ledger Entries |
Multi-currency rounding and suspense postings |
A Power BI report on top of this data turns the table above into a weekly Power BI accounts receivable dashboard your CFO will open. Larger shops on Dynamics 365 Finance can build the same AR dashboard from its customer transactions. If you’re still on Dynamics GP, the report names differ, but the formulas don’t.
What does a one-page weekly AR review look like?
The weekly review is one page and 30 minutes. That page is the output of the Pull and Flag stages, and the meeting covers Explain, Assign and Confirm.
What belongs on a weekly accounts receivable review checklist?
This weekly accounts receivable review checklist is the Monday agenda:
- Pull the aging report and the eight KPIs from the same ledger (5 minutes).
- Flag anything outside its 12-month band, then check the top 10 overdue customers (8 minutes).
- Explain disputes: age, owner, next step (5 minutes).
- Review broken and upcoming promises to pay (4 minutes).
- Review unapplied cash, oldest first (4 minutes).
- Assign each action to a named owner with a date (4 minutes).
Real-World Scenario A typical case we see: a controller at a distributor reads DSO of 43.6 days and thinks collections are slipping. The aging report shows 7.4% over 60 days, which is unremarkable. The unapplied list shows $0.31M of payments sitting in suspense, and the oldest is 9 days. The naive approach sends dunning letters to customers who have already paid. The Explain stage catches it, because the unapplied check comes before any outreach.
What mistakes break the weekly AR review?
- Mixing a count-back DSO with the formula-based DSO in one report
- Using total receivables in CEI instead of current receivables
- Reporting only the average, which hides a few large late accounts
- Ignoring seasonality when you compare weeks
- Dunning disputed invoices the same way as ordinary late ones
Most of this review is preparation. The agents do the pull, the flags and the draft messages, and a person decides.
How does QServices approach AR KPIs?
We start with the Pull stage, because agreed definitions matter more than any dashboard. Our agents run inside your Business Central tenant and your CRM, and a person approves anything that posts money or changes a system.
- A KPI definition sheet, with each formula, owner and trigger agreed in writing.
- A weekly pull from Customer Ledger Entries, built and tested against last month’s close.
- Flag rules set from your own 12-month baseline.
- Draft follow-up messages for flagged accounts, held in an approval queue.
- Unapplied cash matches proposed for review, and promises to pay logged on the account.
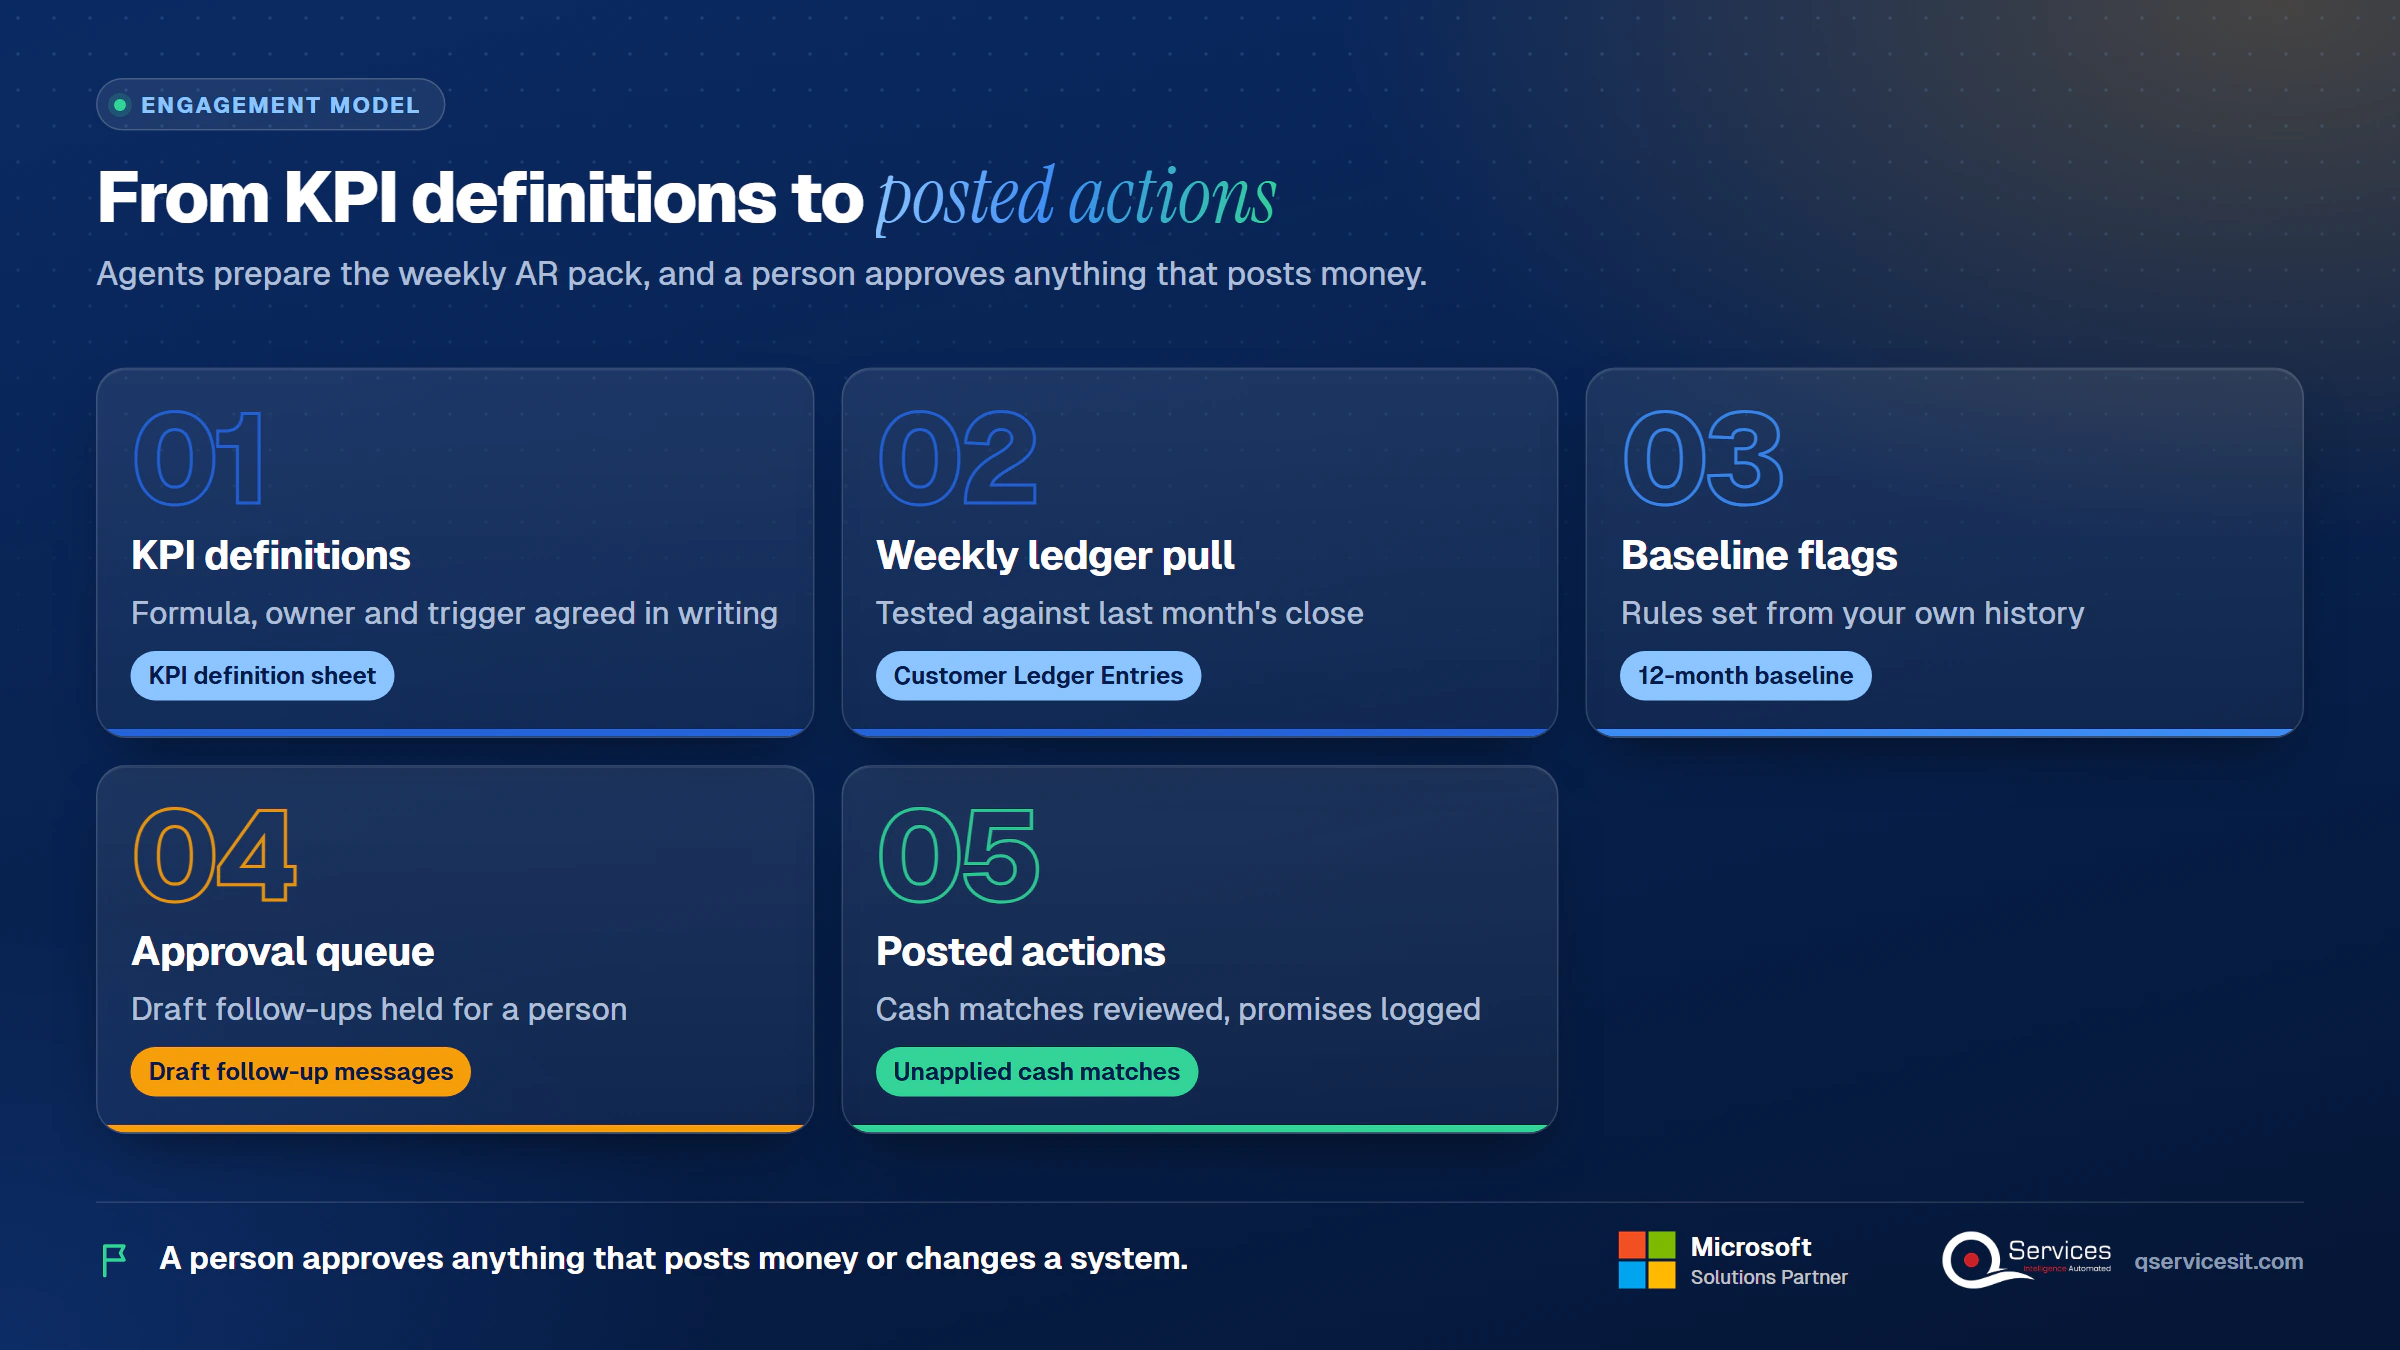
With a manual review, someone spends a morning pulling reports before the meeting starts. With an agent-prepared pack, the meeting time goes to decisions. The same team that builds the agents runs them.
Implementation Checklist
- One written definition for DSO, ADD and CEI, signed off by the controller
- Aging calculated from due date, not posting date
- Disputed invoices tagged so dunning skips them
- Unapplied payments listed daily with age
- 12 months of weekly baselines stored for every KPI
- A named owner on each of the eight KPIs
- A Monday slot booked for the 30-minute review
- Every proposed posting goes through an approval queue
What should you do first to run a weekly AR review?
Start with the one-page pack and one baseline, and run it for four Mondays. Pilot it on your largest customer segment and measure unapplied cash age, ADD, promise kept rate and the time the pack takes to prepare. When you’re ready, and we’ll walk through your ledger.

Written by Rohit Dabra
Co-Founder and CTO, QServices IT Solutions Pvt Ltd
Rohit Dabra is the Co-Founder and Chief Technology Officer at QServices, a software development company focused on building practical digital solutions for businesses. At QServices, Rohit works closely with startups and growing businesses to design and develop web platforms, mobile applications, and scalable cloud systems. He is particularly interested in automation and artificial intelligence, building systems that automate routine tasks for teams and organizations.
Accounts receivableCash applicationERP integrationFinance automation
Talk to Our Experts
Frequently Asked Questions
Related Topics
Next step
Ready to turn the weekly AR review into a habit?
Talk to our team about agents that sit inside your ERP and CRM, prepare the work behind these metrics, and leave every posting to your approval.




















 Trustpilot5.0★★★★★See reviewsGoodFirms5.0★★★★★45 verified reviews
 G25.0★★★★★See reviewsClutch5.0★★★★★Quality 5.0 · Schedule 4.8
 Google4.7★★★★★Mohali office
 Erik BrownBusiness owner and software engineerClient review
 Zoltan BodnarCFO, Yusen LogisticsGoodFirms
 Ranbeer MakinClientClient review
 Alex VanderElsClientClient review
 Philmore J.ClientClient review
 Michael WilliamsonPresident and CEO, United Way of Southeast LouisianaGoodFirms
 Steven LewisClientClient review
 Brian WallerPresident, Technology Association of IowaGoodFirms