

Collection effectiveness index: the AR metric DSO hides

Isometric illustration of two stacks of invoices with gauges comparing a collection effectiveness score against a days sales outstanding dial. - collection effectiveness index
Summarize in:
Get an instant AI summary of this article

Introduction

To calculate the collection effectiveness index, take beginning receivables plus credit sales minus ending total receivables, divide by beginning receivables plus credit sales minus ending current receivables, then multiply by 100. Use one period, usually a month, for all four inputs.

Most CFOs already watch DSO, but DSO can look healthy while your accounts receivable collections slip. CEI shows how much of the money you could have collected, you actually did. Two companies can post the same DSO and have very different CEI, and we’ll show that with numbers.

In This Article, You'll Learn
  • How to calculate collection effectiveness index from four balances you already have
  • A worked example where two companies share one DSO and land 24 points apart
  • Why CEI exposes past-due risk that DSO averages away
  • What a good CEI looks like, and why a blanket 85% target can mislead
  • How to use CEI to measure collector performance fairly
  • A checklist to put the metric into your monthly close

Is your DSO hiding a weak collection rate?

A 30-minute call to map your invoice-to-cash flow and see where collections stall. Your team approves every action the agents take.

Book the AR Cash Assessment →

Quick Answer The collection effectiveness index is the percentage of receivables you could have collected in a period that you actually collected. A score of 100 is perfect. Unlike DSO, it separates money that is merely outstanding from money that is past due, so it measures collection performance, not just speed.

What Is the Collection Effectiveness Index Formula?

The CEI formula compares what you collected against what was collectible. The AccountingTools CEI definition gives the standard form:

CEI = (Beginning receivables + Credit sales – Ending total receivables) / (Beginning receivables + Credit sales – Ending current receivables) x 100

The top line is cash collected. The bottom line is everything that was due or already past due. Think of it as one question: how much of what was collectible did we get?

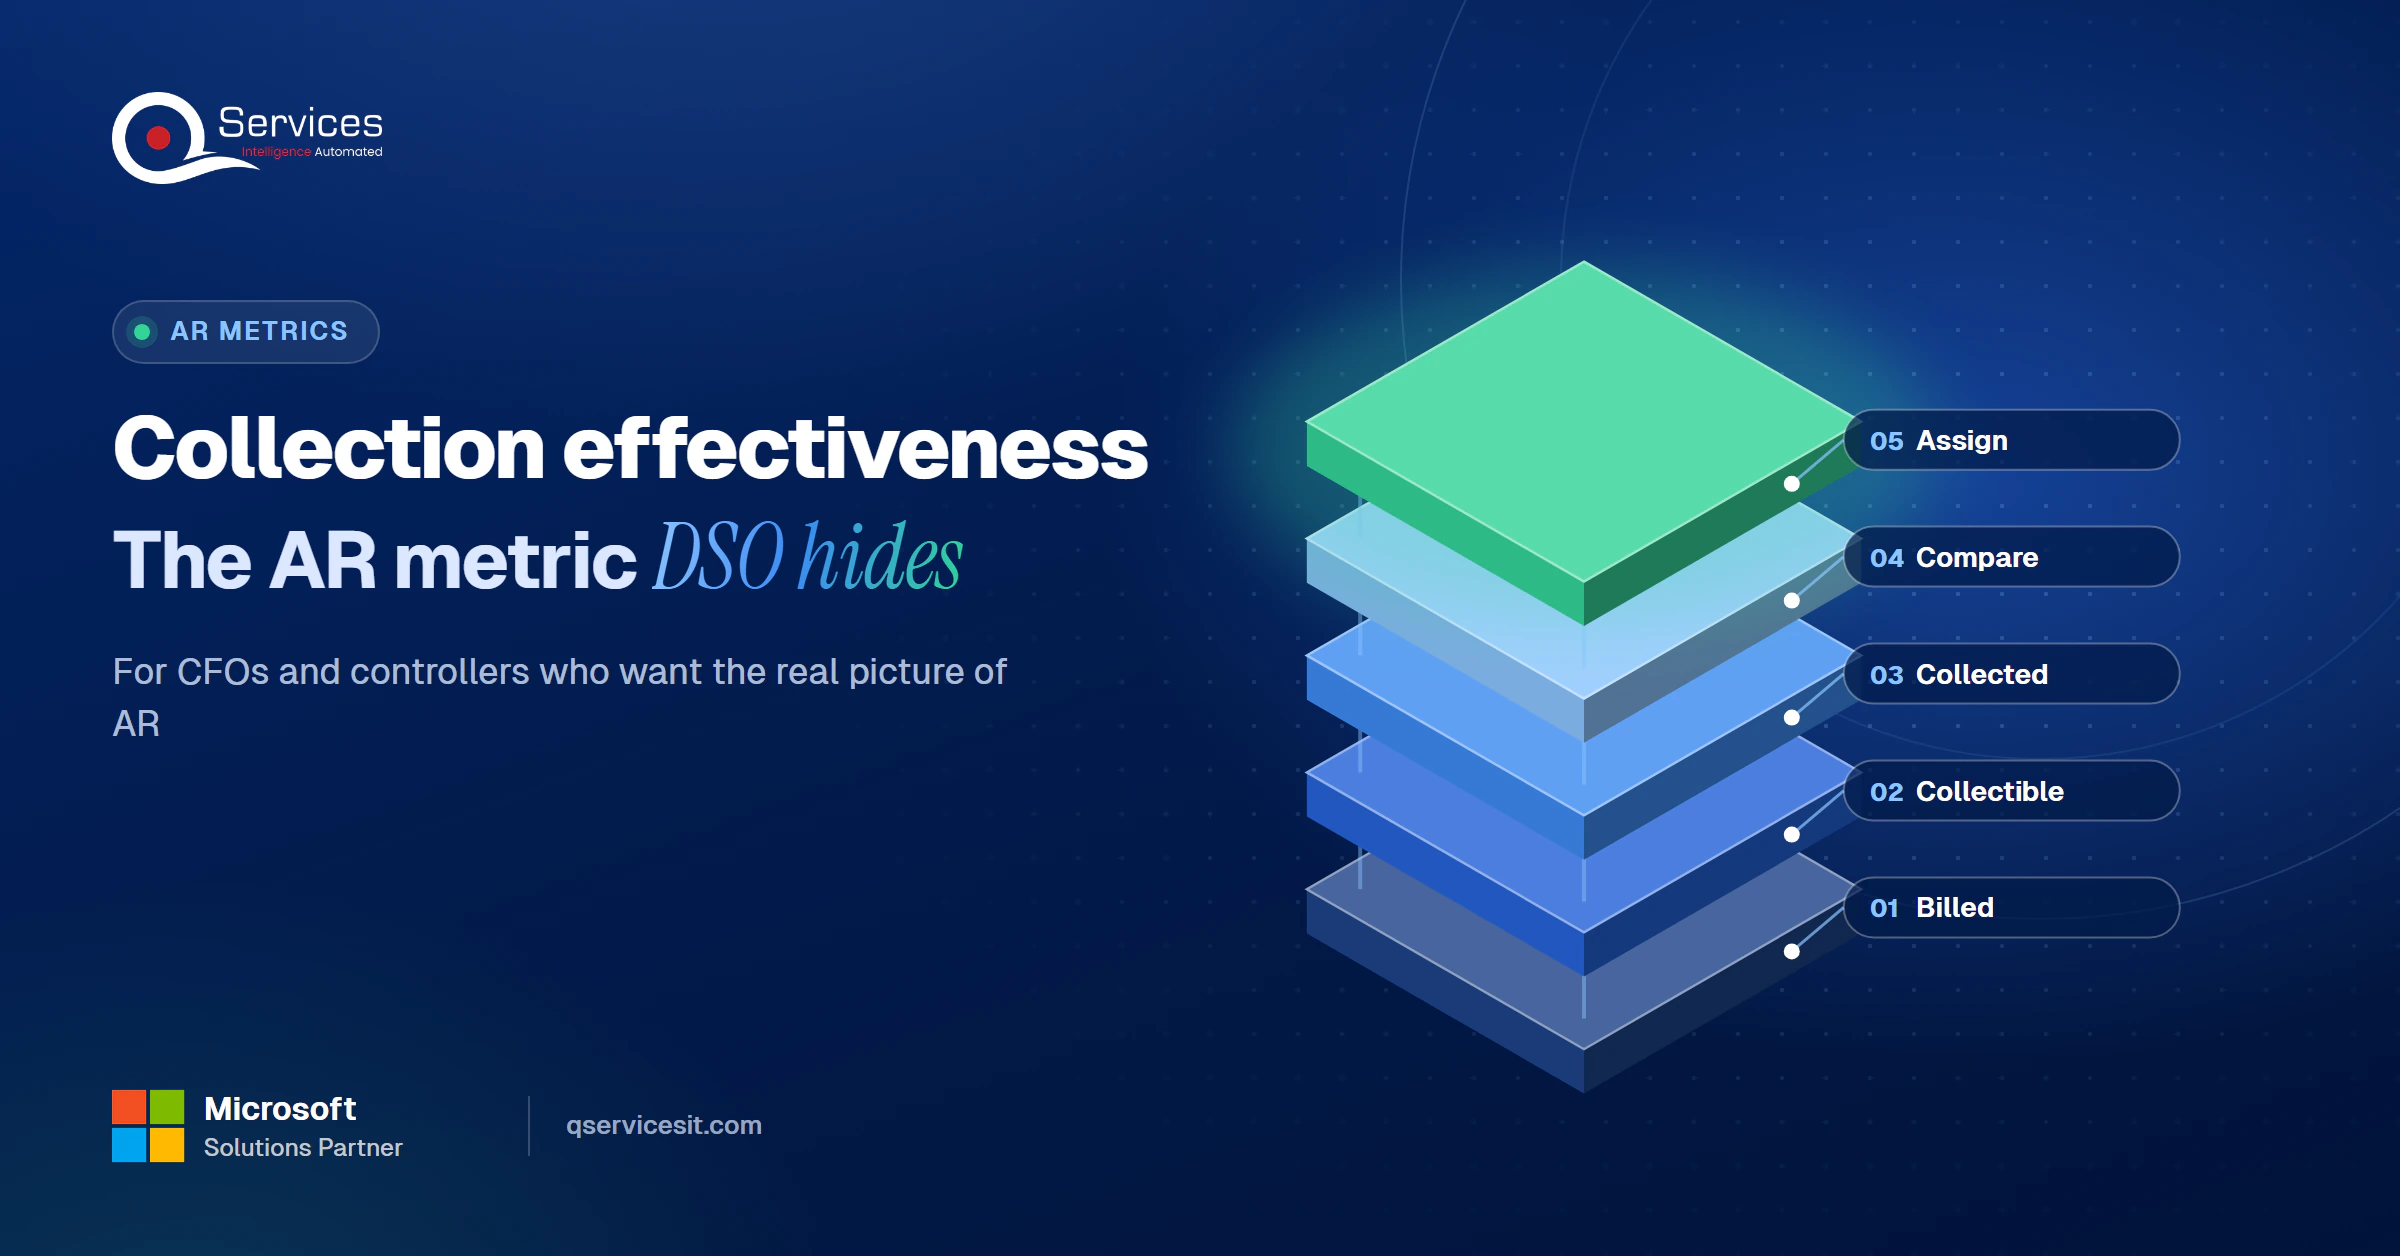
The QServices Framework CEI Review = Billed → Collectible → Collected → Compare → Assign

Work in this order because you can’t judge collected cash until you’ve fixed what was collectible, and a score means nothing until someone owns the gap.
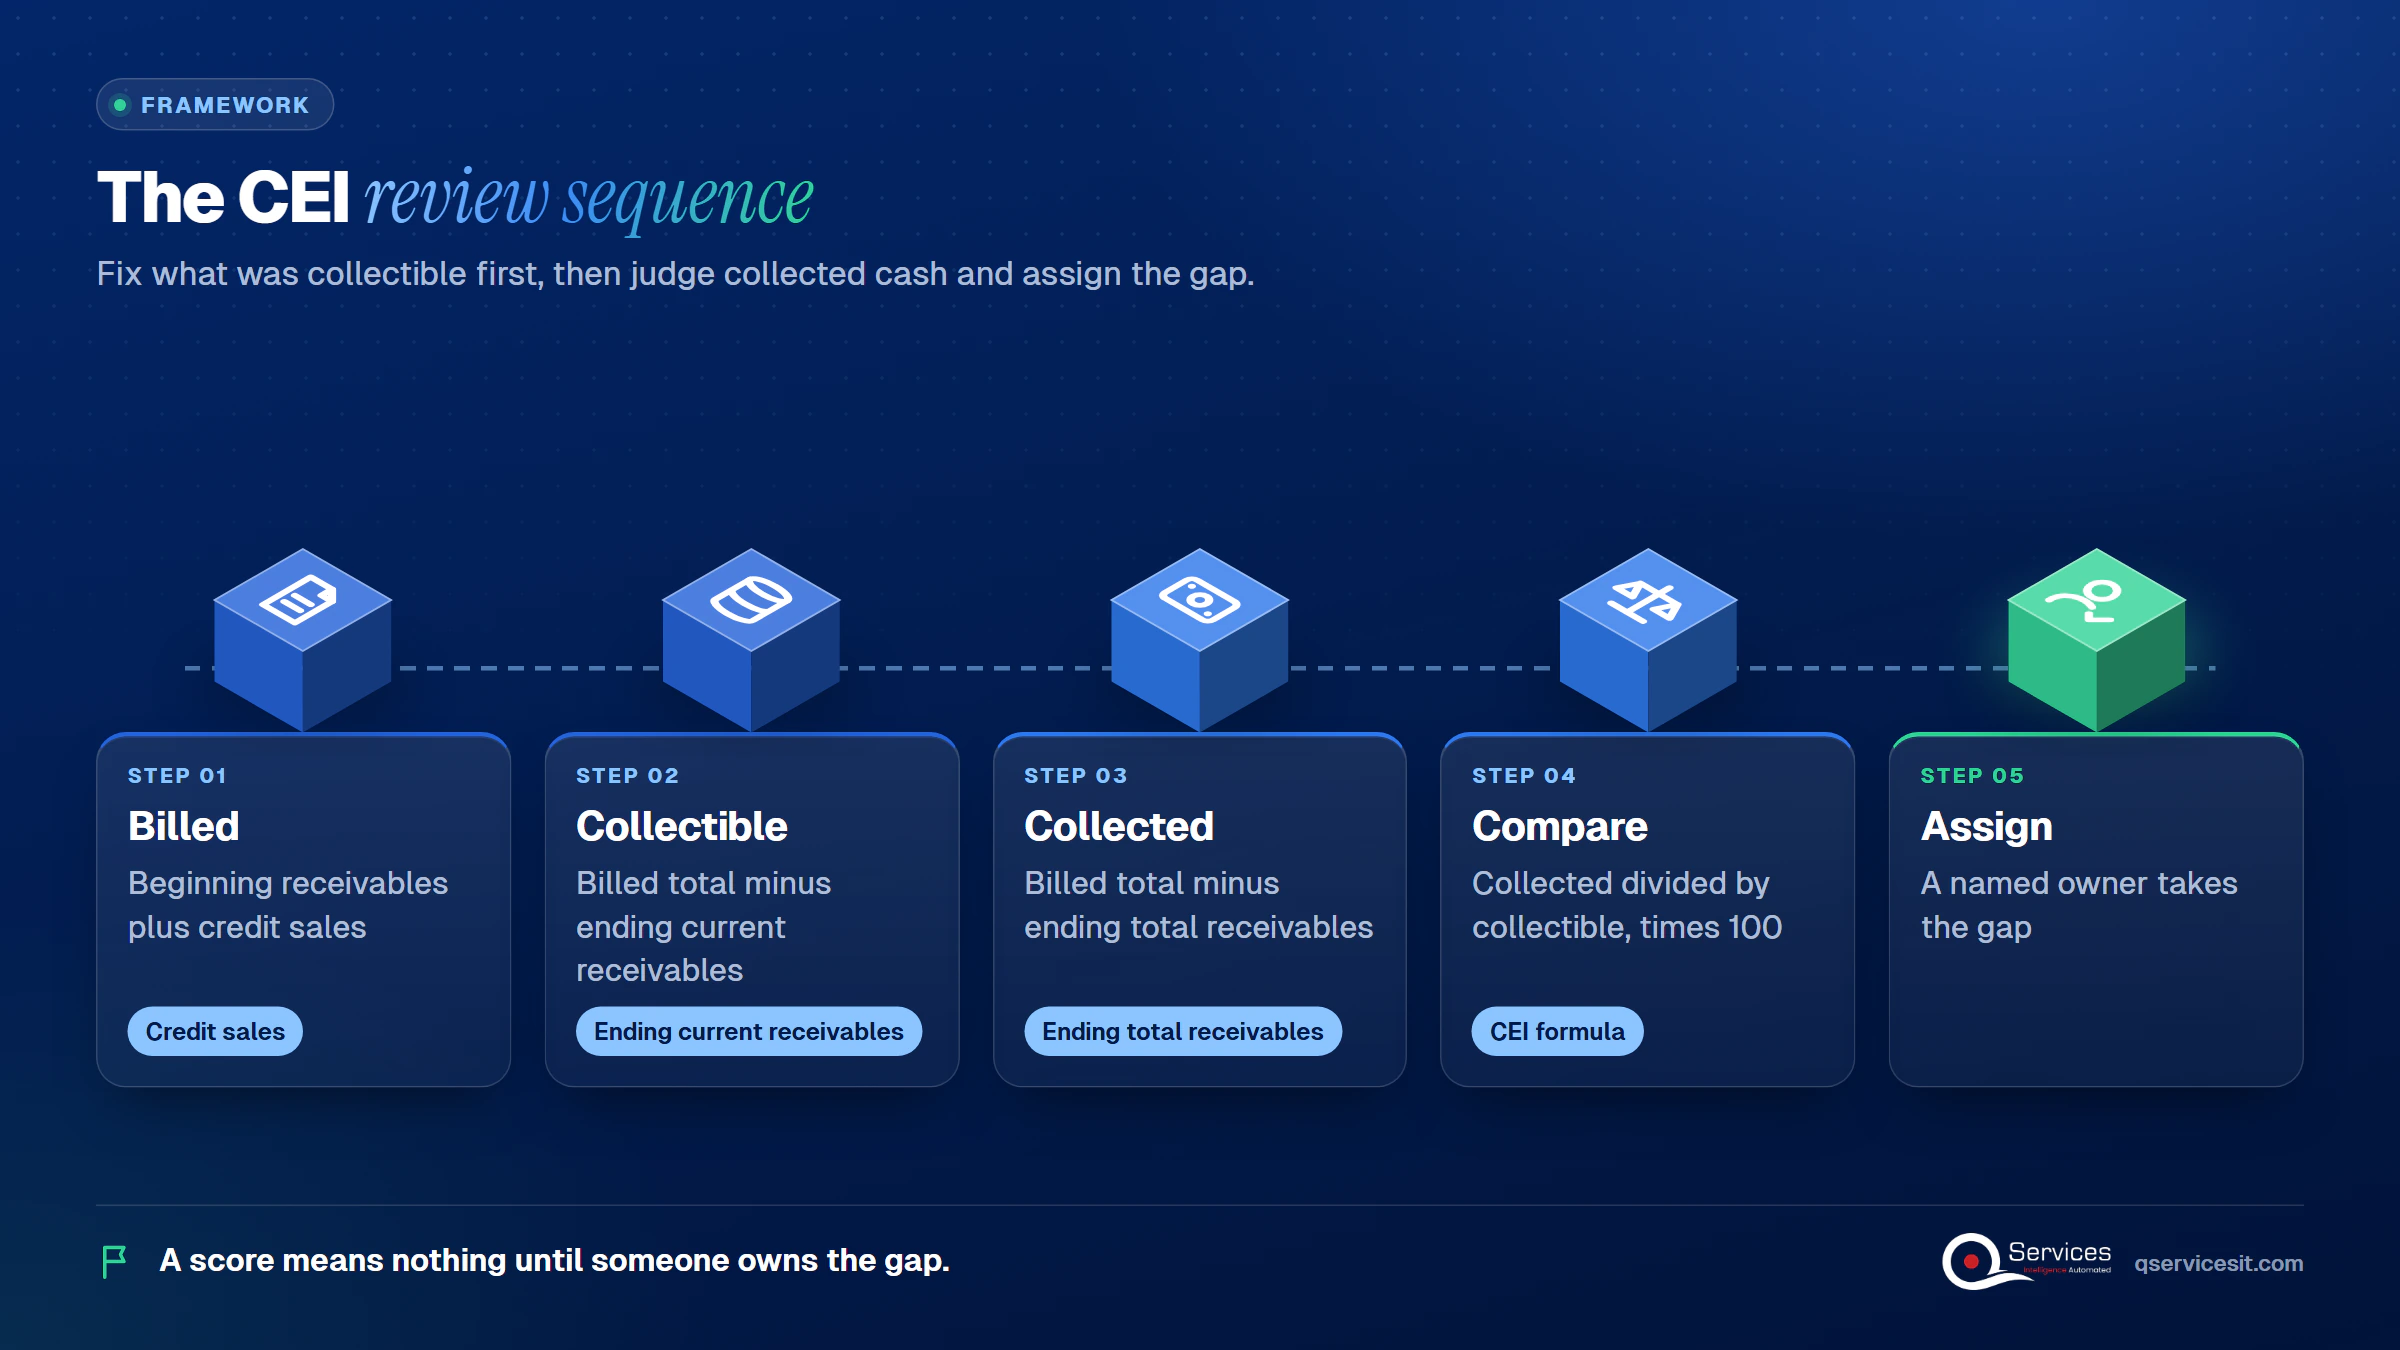
QServices CEI Review framework: Billed → Collectible → Collected → Compare → Assign - collection effectiveness index

How to calculate collection effectiveness index step by step

  1. Pull beginning receivables for the period.
  2. Add credit sales for the same period.
  3. Subtract ending total receivables to get cash collected.
  4. Subtract ending current receivables from step 2’s total to get the collectible amount.
  5. Divide collected by collectible and multiply by 100.

What counts as current?

Current means not yet due. Some teams stretch that to 60 days or less, so state your cutoff every time you report. Changing it mid-year makes trend lines useless. Variants exist, including simplified versions that skip the current-balance adjustment, so check any vendor example before you copy it.

A Collection Effectiveness Index Worked Example

This example is illustrative, constructed by us, not sourced. Both companies start the month with $1,000,000 in receivables, bill $1,000,000 on credit, and end with $1,000,000 in total receivables. Their DSO is identical at roughly 30 days.

Company A Company B
Beginning AR $1,000,000 $1,000,000
Credit sales $1,000,000 $1,000,000
Ending total AR $1,000,000 $1,000,000
Ending current AR $900,000 $500,000
CEI 90.9% 66.7%

Company A: 90.9%

(1,000,000 + 1,000,000 – 1,000,000) / (2,000,000 – 900,000) = 1,000,000 / 1,100,000 = 90.9%.

Company B: 66.7%

(1,000,000 + 1,000,000 – 1,000,000) / (2,000,000 – 500,000) = 1,000,000 / 1,500,000 = 66.7%.

Same DSO, a 24-point gap, because B is carrying far more past-due money.

Why Collection Effectiveness Index vs DSO Tells You More

DSO measures the revenue-to-cash cycle. CFO.com’s analysis of the trouble with DSO quotes Credit Research Foundation president Terry Callahan making the point that payment terms drive most of DSO, so a 30-day-terms company is unlikely to push DSO below 30 whatever its collectors do.

Why same DSO can have different CEI

DSO averages. A $100 invoice one day late and a $1,000,000 invoice 45 days late can produce the same blended number. CEI weights by dollars and by what’s overdue, so the big late invoice drags the score down where it belongs.

Key Insight DSO tells you how long cash takes to arrive. CEI tells you how well your team collected what was due. In our example, one DSO produced scores of 90.9% and 66.7%.

CEI vs DSO for CFOs: a side-by-side

DSO CEI
Question answered How long does cash take? How much collectible cash did we get?
Affected by payment terms Heavily Much less
Seasonal or growth swings Distorted Less distorted
Shows past-due severity No Partly
Data needed Totals only Totals plus an aging split (more setup)
Weakness Hides who is late Write-offs inflate it; backward-looking

CEI costs more to set up because you need clean current-versus-past-due balances. Pair it with DSO, best possible DSO and average days delinquent (DSO minus best possible DSO), and read it next to your AR aging report. These accounts receivable metrics work as a set.

Do your collectors chase the right invoices?

See how follow-ups line up against the invoices that actually go late. We review it with you in the AR Cash Assessment.

Book the AR Cash Assessment →

What Is a Good Collection Effectiveness Index?

There’s no standard. Vendor guides call anywhere from 80% to 90% good, and 100% is unrealistic. The Credit Research Foundation’s national summary of domestic trade receivables shows member medians for CEI around 79 and DSO around 37.5 in the table we reviewed, though the page doesn’t label the period, so check the current edition before you quote it.

So a flat 85% bar is aggressive for a typical company. Our rule: benchmark against your own history, your industry and your terms, and ask what a good CEI percentage means for a CEI benchmark for US finance teams like yours.

Standards & References

  • CRF national summary of domestic trade receivables: median CEI, DSO and best possible DSO for member companies

Limits to remember

  • Write-offs shrink receivables and flatter the score.
  • It covers credit sales only and looks backward.
  • It moves with your definition of current.

Using CEI to Measure Collector Performance

CEI works at the portfolio level, so calculate it on each collector’s own accounts. That’s our inference, not a published method, but it’s how teams make AR collector performance metrics fairer than raw DSO, which mostly reflects customer terms.

Real-World Scenario A typical case we see: a controller has two collectors, each with $400,000 starting AR, $300,000 of credit sales and $380,000 ending AR. Collector 1 has $300,000 current, so CEI is 320,000 / 400,000 = 80%. Collector 2 has $200,000 current, so CEI is 320,000 / 500,000 = 64%. Balances match, but Collector 2’s portfolio is far more past due. At the Compare stage, the gap becomes a customer-level review, not a blanket complaint.

Track it monthly, use it to rank customers by lowest score, and review it with the reduce DSO plan for a stretched AR team. A Power BI accounts receivable dashboard can show CEI by collector next to DSO.

How QServices Approaches Collection Effectiveness Index

We start at Billed and Collectible: clean inputs first, because a CEI built on messy aging is noise. Our AI agents work inside your ERP, and your team approves every action before anything posts.
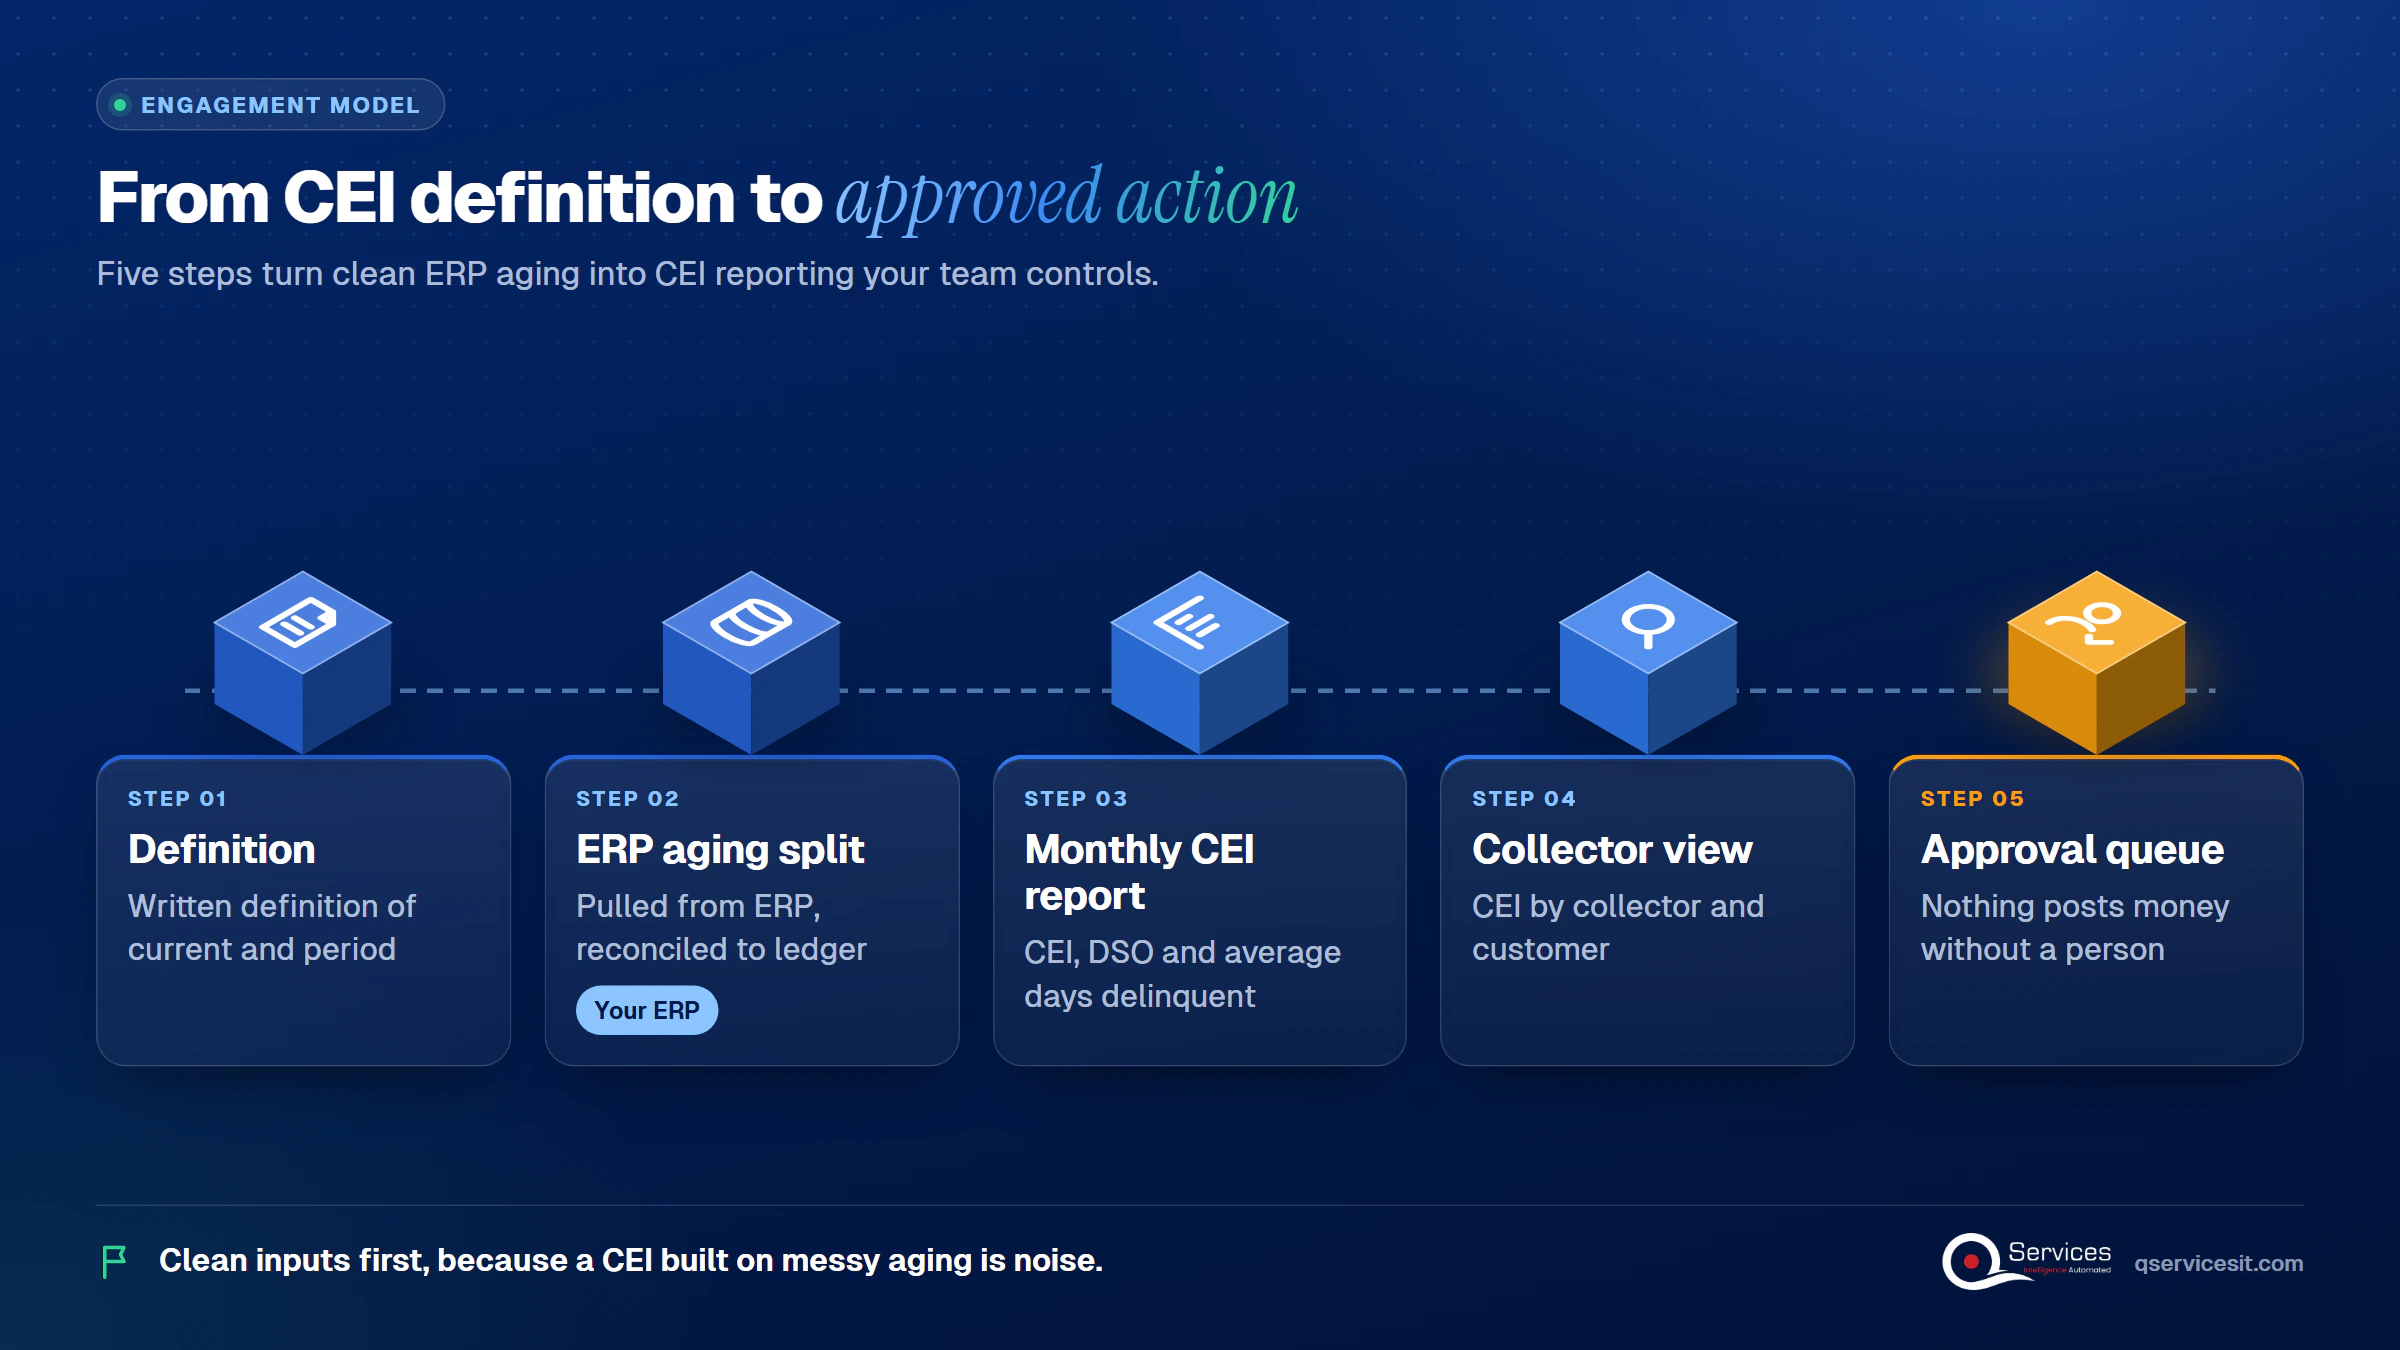
  1. A written definition of current and the reporting period
  2. An aging split pulled from your ERP, reconciled to the ledger
  3. A monthly CEI, DSO and average days delinquent report
  4. CEI by collector and by customer, with the lowest scores flagged
  5. An approval queue so nothing posts money without a person
How QServices delivers CEI reporting: Definition → ERP aging split → Monthly CEI report → Collector view → Approval queue - collection effectiveness index

This sits inside our accounts receivable automation work, with agents running in your own Azure tenant. See also our accounts receivable management guide.

Implementation Checklist

  • Cutoff for current balances written down and approved
  • Beginning, ending total and ending current AR reconcile to the ledger
  • Credit sales exclude cash sales
  • Write-offs are tracked separately
  • CEI is calculated per collector
  • CEI is reported next to DSO every month
  • A named owner exists for the lowest-scoring customers

Conclusion

The collection effectiveness index gives you what DSO can’t: a dollar-weighted view of whether your team collected what was due. Pilot it on one collector’s portfolio next month, then book the AR Cash Assessment.

Rohit Dabra

Written by Rohit Dabra

Co-Founder and CTO, QServices IT Solutions Pvt Ltd

Rohit Dabra is the Co-Founder and Chief Technology Officer at QServices, a software development company focused on building practical digital solutions for businesses. At QServices, Rohit works closely with startups and growing businesses to design and develop web platforms, mobile applications, and scalable cloud systems. He is particularly interested in automation and artificial intelligence, building systems that automate routine tasks for teams and organizations.

Accounts receivableFinance automationERP integrationAI agent development
Talk to Our Experts

Frequently Asked Questions

CEI, the collection effectiveness index, is the percentage of receivables that were collectible in a period that you actually collected. A score of 100 is perfect. It measures collection performance, where DSO measures how long cash takes to arrive.

CEI = (beginning receivables + credit sales – ending total receivables) / (beginning receivables + credit sales – ending current receivables) x 100. Use the same period for all four inputs, usually a month, and state your cutoff for current balances.

There’s no standard. Vendor guides range from about 80% to 90%, and CRF member medians sit near 79. Benchmark against your own history, industry and payment terms, and treat 100% as unrealistic.

Yes. With $1,000,000 beginning AR, $1,000,000 credit sales and $1,000,000 ending AR, both have the same DSO. If $900,000 is current, CEI is 90.9%. If only $500,000 is current, it’s 66.7%.

Reconcile beginning, ending total and ending current AR to your ledger, fix your current cutoff, and calculate CEI monthly alongside DSO. Then repeat it on each collector’s own portfolio to see where past-due money sits.

Related Topics

Next step

Ready to see your real collection performance?

Bring your aging report. We’ll walk through where cash slows and what an AI agent inside your ERP could handle, with your team approving each step.

Book the AR Cash Assessment →

Recent Articles

Globally Esteemed on Leading Rating Platforms

Earning Global Recognition: A Testament to Quality Work and Client Satisfaction. Our Business Thrives on Customer Partnership

5.0

5.0

5.0

5.0

What clients say

Rated 5.0 by the
people we've built for.

Every quote comes from a published review on GoodFirms, Clutch or our own site. Click a source to read the full review.

★★★★★
“QServices was highly professional, knowledgeable, and approachable. We continue to work with them on other projects.”
NHNicholas HoareCEO, Nextgen ClearingGoodFirms
★★★★★
“Quality assurance is often overlooked, but these guys take that very seriously. … their team of experienced, dedicated developers and highly skilled engineers quickly dissected and decomposed every problem and presented solutions and options that directly met my needs”

Erik BrownBusiness owner and software engineerClient review
★★★★★
“The supplier delivered the application on time and was responsive to our needs. He was also flexible, which allowed us to make changes on the fly.”

Zoltan BodnarCFO, Yusen LogisticsGoodFirms
★★★★★
“Thank you Sahil and team for wonderful collaboration right from day 0. … Highly recommend the developers.”

Ranbeer MakinClientClient review
★★★★★
“They are always looking for new ways to improve their products and services and to deliver value to their customers.”
OFOluwatosin FalolaSenior .NET Developer, POOLCORPClutch
★★★★★
“I have had an excellent experience working with QServices. We have a highly collaborative relationship and I value them not just as contractors but as partners.”

Alex VanderElsClientClient review
★★★★★
“Sahil undertakes every project with a high degree of professionalism. His communication style is unmatched and he is always available to resolve issues or just discuss the project.”

Philmore J.ClientClient review
★★★★★
“Responsive, patient and professional. Consistent weekly attention to our project, and new ideas we hadn't asked for.”

Michael WilliamsonPresident and CEO, United Way of Southeast LouisianaGoodFirms
★★★★★
“I have been working with them on a project for a year now … They have been able to solve problems that come up with bugs or development and able to communicate well with me.”

Steven LewisClientClient review
★★★★★
“We had been working on the app for two years. QServices built it in two months.”

Brian WallerPresident, Technology Association of IowaGoodFirms
★★★★★
“All projects were delivered on time and were fully completed upon delivery.”
RBRaine Marie BuenvendiaSr. Support Specialist, Arc.DevClutch
★★★★★
“They had excellent quality. The hypercare they provided after the project went live is exceptional.”

KKKrish KishorePresident, Zero Hour ConsultantsClutch
Book Appointment
Sahil kataria (1)
Sahil Kataria

Founder and CEO

amit Kumar
Amit Kumar

Chief Sales Officer

Talk To Sales

USA

+1 270-550-1166

flag

+1 270-550-1166

Phil J.
Phil J.Head of Engineering & Technology​
QServices Inc. undertakes every project with a high degree of professionalism. Their communication style is unmatched and they are always available to resolve issues or just discuss the project.​
Assured

Thank You

Thanks, we’ve got your details. A named member of our team will reply within one business day.