

Power BI accounts receivable dashboard your CFO will open

Isometric illustration of a finance dashboard with six chart panels linked to a central data model and an ERP database. - power bi accounts receivable dashboard
Summarize in:
Get an instant AI summary of this article

Introduction

A Power BI accounts receivable dashboard should show six things: DSO, aging buckets, collection effectiveness, top overdue customers, unapplied cash and a cash forecast. Put them on one page with a "data as of" stamp, and a CFO can read it in two minutes.

Most AR reports fail because they bury those numbers under 20 visuals and a stale refresh. Our Power BI and data work (supporting) starts from the opposite end: what the CFO decides on Monday morning, then the data model that feeds it.

In This Article, You'll Learn
  • Which six visuals belong on a CFO receivables dashboard, and which to leave off
  • How to build an AR aging report in Power BI that answers "as of when?"
  • The star-schema data model that keeps DSO and aging consistent
  • How to get ERP data into Power BI without hammering production
  • Which refresh and access settings break most often in finance reports

Is your AR data ready for a CFO dashboard?

We review how invoices, payments and customer data flow out of your ERP, and show what a reliable receivables dashboard would need underneath it.

Book a process assessment →

Quick Answer A Power BI accounts receivable dashboard turns open-invoice data from your ERP into six CFO views: DSO, aging buckets, collection effectiveness, top overdue customers, unapplied cash and a cash forecast. It works when the data model is a star schema, the aging uses an as-of date and the refresh is visible.

What Does a CFO Want From a Power BI Accounts Receivable Dashboard?

A CFO wants to know three things: how much cash is stuck, how old it is and whether it is getting better. Everything else is detail for the collector, not the front page.

That is why we build every Power BI finance dashboard in the same order. The model below is the one we reuse.

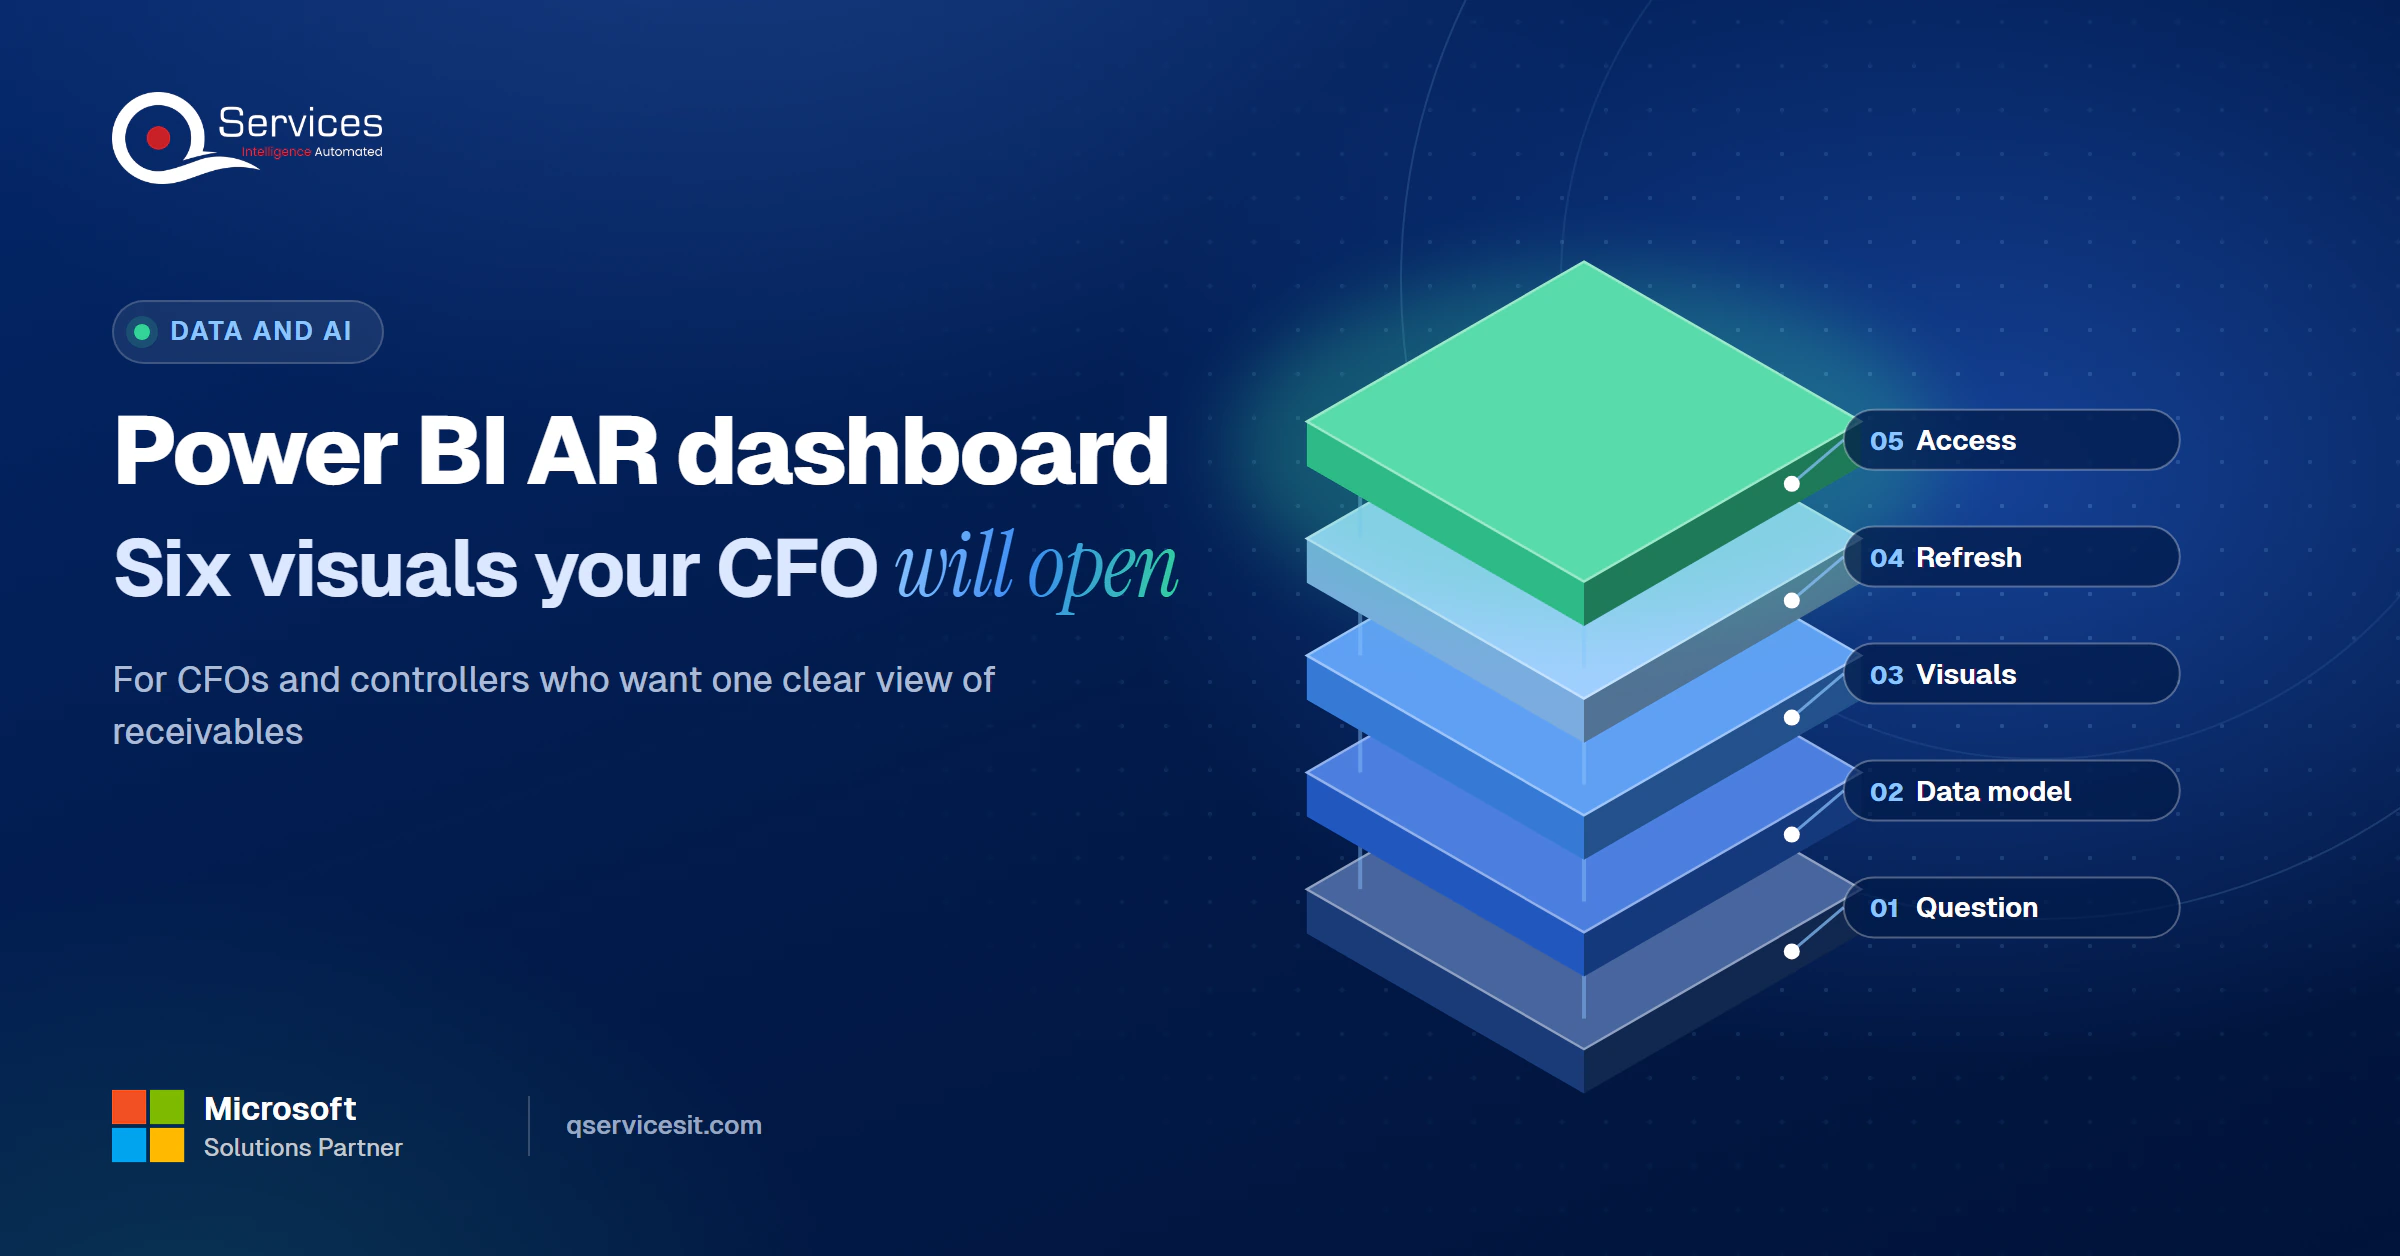
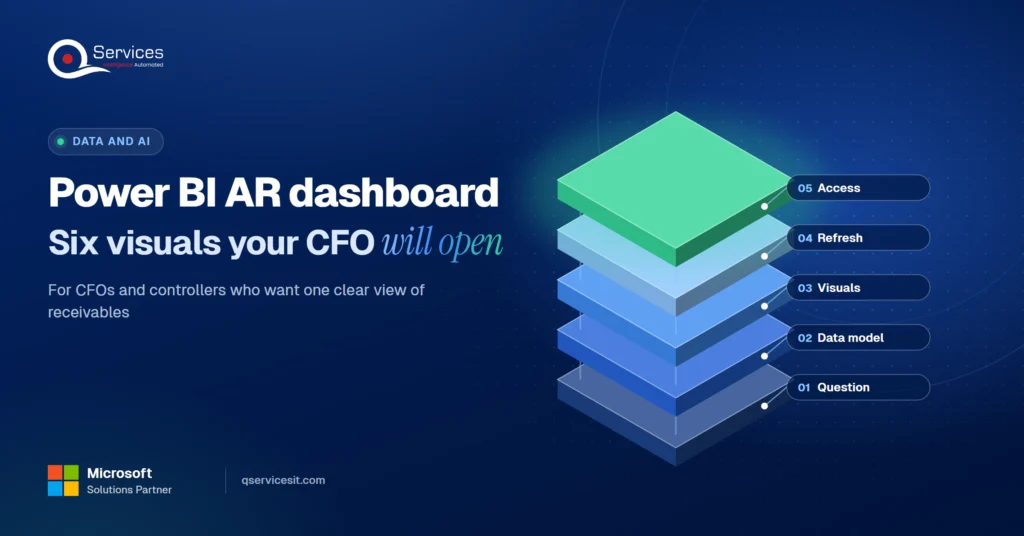
The QServices Framework Receivables Dashboard = Question → Data model → Visuals → Refresh → Access

Start with the question, because it decides the grain of the data model. Visuals come after the model, and refresh and access come last because they only matter once the numbers are right.

QServices Receivables Dashboard framework: Question → Data model → Visuals → Refresh → Access - power bi accounts receivable dashboard

What KPIs belong on an accounts receivable KPI dashboard?

The short list is DSO, aging, collection effectiveness, overdue concentration, unapplied cash and forecast. We cover each below. If DSO is the number your board asks about, our days sales outstanding formula guide covers the maths and the levers.

Why one page beats ten

Microsoft’s own optimization guidance says to limit visuals per page and push detail into drillthrough and tooltip pages. Keep the front page for the CFO, and put customer-level detail one click away for the collector.

The 6 Visuals That Matter on a CFO Receivables Dashboard

The six-visual set is our editorial choice, not a standard. It covers position, age, trend and risk without crowding the page. Sample data should always be labelled as sample.

Grid of exactly 6 visuals on the CFO receivables page: DSO trend card, AR aging buckets, Collection effectiveness index, Top 10 overdue customers, Unapplied cash and credits, 13-week cash forecast - power bi accounts receivable dashboard

1. DSO trend

This is the DSO dashboard in Power BI at its simplest: a card and a 13-month line. The basic measure is ending receivables divided by credit sales, times days in the period. State your period length on the visual, because sources differ.

2. Aging buckets

A column chart with four buckets: 1-30, 31-60, 61-90 and 91+ days. This is the heart of any AR aging dashboard. Show dollars and invoice count side by side.

3. Collection effectiveness index

CEI is (beginning AR + credit sales – ending total AR) / (beginning AR + credit sales – ending current AR) x 100. It shows how much of what was collectible you actually collected.

4. Top overdue customers

A ranked bar of the ten customers with the most past-due dollars. Drillthrough to the invoice list, with the collector’s name.

5. Unapplied cash and credit memos

Unapplied cash makes DSO look better or worse than reality. If it is piling up, read our guide to clearing the unapplied cash backlog.

6. Cash forecast

A 13-week bar of expected receipts, based on due dates and each customer’s average days to pay. Label it as a forecast.

Key Insight DSO alone hides the problem. A 37-day DSO can sit on top of a growing 91+ bucket, so always pair the DSO card with the aging chart.

How to Connect ERP Data to Power BI for AR

Power BI ERP integration comes down to one decision: query the ERP directly or stage the data first. Either way, build the model before the visuals.

Power BI data model for accounts receivable

Microsoft’s star schema guidance puts descriptive entities in dimension tables and events in fact tables. For AR, the fact is the open-invoice or customer-ledger row. The dimensions are Customer, Date, Currency, Entity and Collector.

Invoice date, due date and posting date are role-playing dimensions. Only one relationship can be active, so create a Date table per role or use USERELATIONSHIP. Microsoft also notes a Type 2 slowly changing dimension, such as customer credit tier over time, cannot be produced in Power Query and needs a warehouse.

How to build an AR aging report in Power BI

Use an as-of-date slicer on a Date table and one measure per bucket. Treat an invoice as open if it was closed after the as-of date, or has no close date. Write and test your own DAX against a month-end ledger report, because the totals must tie out to the penny.

Direct ERP connection vs warehouse layer

Factor Direct to ERP Staging or warehouse layer
Setup effort Days Weeks
Load on production ERP Every refresh queries it Only the nightly extract does
History and as-of aging Limited to what the ERP keeps Full snapshots
Credit tier over time Not possible Supported
Cost and skills Lower, Power BI only Higher, needs a data engineer

The warehouse costs more to start and needs a skill your team may not have. We still recommend it once you need as-of aging. Business Central has a native Power BI connector and Microsoft recommends API pages over OData web services, with a default page size of 5,000 rows. Our ETL pipeline design guide shows the staging pattern.

Real-World Scenario A typical case we see: a controller at a US distributor with about $40M in revenue reports aging from a Power BI page that always shows today’s date. In March she cannot reproduce February’s 61-90 bucket, so the board deck and the dashboard disagree by roughly $300K. The fix sits in the Data model stage: a month-end snapshot table and an as-of slicer, so every past bucket can be rebuilt.

Do your aging numbers match your ERP?

Dashboards fail when the data model underneath is wrong. A short assessment traces your invoice and payment data from ERP to report so the visuals tell the truth.

Book a process assessment →

Power BI Scheduled Refresh and Access for Finance Data

Good numbers still fail if the refresh stalls or the wrong person sees the wrong customer. These are the limits to plan around.

How often should an AR dashboard refresh?

Power BI Pro allows up to 8 scheduled refreshes a day, and Premium or Fabric capacity allows up to 48. For AR, one refresh after the nightly ERP posting is usually enough. A refresh can start up to an hour late, and it is disabled after four consecutive failures, often from expired credentials. Add a visible "data as of" stamp.

Row-level security for collectors

Row-level security applies only to workspace Viewers, not Admins, Members or Contributors. Dynamic RLS with USERPRINCIPALNAME() and a mapping table lets each collector see only their customers.

Standards & References

5 Common Power BI Mistakes in Accounts Receivable Reporting

These are the common Power BI mistakes in accounts receivable reporting we fix most often.

1. Aging as of today only

Without an as-of date, you cannot reproduce last month.

2. Mixing posting and due dates

Buckets built on posting date overstate how late invoices are. Pick due date and say so.

3. Letting unapplied cash and credits distort DSO

Net them out or show them separately, or collectors chase customers who already paid. A leaner team can still cut days: see how to reduce DSO with a stretched AR team.

4. No "data as of" stamp

A stale page that looks current is worse than no page.

5. Querying the production ERP directly

Microsoft warns that handing out.pbix files makes each user refresh against Business Central, which can slow it for everyone.

How QServices Approaches the Power BI AR Dashboard

We fix the question and the data model first, because the visuals only repeat what the model allows. The same team builds and runs it, and any agent that posts cash waits for a person to approve it.

  1. A one-page question list agreed with the CFO and controller
  2. A star-schema model with a month-end snapshot table
  3. The six visuals, tied out to your month-end ledger report
  4. A scheduled refresh with failure alerts and a "data as of" stamp
  5. Row-level security mapped to collectors, tested per role
How QServices delivers the AR dashboard: Question list → Star-schema model → Six visuals tied to ledger → Refresh with alerts → Role-based access - power bi accounts receivable dashboard

The feed from your ERP is part of our ERP integration services, and the older reports it replaces often belong in an application modernization plan. For scope, see our Power BI dashboard development process.

Implementation Checklist

  • Fact table loads one row per open invoice at a consistent grain
  • Separate Date tables exist for invoice, due and posting dates
  • Aging has an as-of slicer, and last month’s buckets match the ledger
  • Unapplied cash and credit memos are shown separately from DSO
  • Refresh runs after the nightly ERP posting, with failure alerts on
  • A "data as of" stamp appears on every page
  • Row-level security is tested per role, with Viewer access confirmed

Conclusion

Pick one entity, build the six visuals on a star-schema model with an as-of date, and measure two things for 30 days: how long month-end aging takes to produce and how many numbers the CFO questions. Book a process assessment and we will review your ERP data and current AR report with you.

Rohit Dabra

Written by Rohit Dabra

Co-Founder and CTO, QServices IT Solutions Pvt Ltd

Rohit Dabra is the Co-Founder and Chief Technology Officer at QServices, a software development company focused on building practical digital solutions for businesses. At QServices, Rohit works closely with startups and growing businesses to design and develop web platforms, mobile applications, and scalable cloud systems. He is particularly interested in automation and artificial intelligence, building systems that automate routine tasks for teams and organizations.

Accounts receivablePower BI reportingERP integrationFinance automation
Talk to Our Experts

Frequently Asked Questions

The best KPIs for accounts receivable are DSO, aging buckets (1-30, 31-60, 61-90, 91+), collection effectiveness index, top overdue customers, unapplied cash and a 13-week cash forecast. Together they show how much cash is stuck, how old it is and whether collections are improving.

To calculate DSO in Power BI, divide ending receivables by credit sales for the period and multiply by the days in that period. Build it as a DAX measure over your invoice fact table and Date dimension, and state the period length on the visual.

Model open invoices as a fact table, add an as-of-date slicer on a Date table and write one measure per bucket (1-30, 31-60, 61-90, 91+). Treat an invoice as open if it was closed after the as-of date, then tie totals to your ERP’s month-end ledger report.

Yes. Business Central has a native Power BI connector, and other ERPs connect through APIs, ODBC or exports. For production use, staging the data in a warehouse reduces load on the ERP and allows as-of aging.

For most finance teams, one refresh after the nightly ERP posting is enough. Power BI Pro allows up to 8 scheduled refreshes a day, so add a visible data-as-of stamp and failure alerts rather than refreshing more often.

Related Topics

Next step

Want a dashboard built on clean AR data?

Bring your ERP and your current aging report. We’ll map where the numbers come from and where they drift, then outline a practical path to a dashboard you trust.

Book a process assessment →

Recent Articles

Globally Esteemed on Leading Rating Platforms

Earning Global Recognition: A Testament to Quality Work and Client Satisfaction. Our Business Thrives on Customer Partnership

5.0

5.0

5.0

5.0

What clients say

Rated 5.0 by the
people we've built for.

Every quote comes from a published review on GoodFirms, Clutch or our own site. Click a source to read the full review.

★★★★★
“QServices was highly professional, knowledgeable, and approachable. We continue to work with them on other projects.”
NHNicholas HoareCEO, Nextgen ClearingGoodFirms
★★★★★
“Quality assurance is often overlooked, but these guys take that very seriously. … their team of experienced, dedicated developers and highly skilled engineers quickly dissected and decomposed every problem and presented solutions and options that directly met my needs”

Erik BrownBusiness owner and software engineerClient review
★★★★★
“The supplier delivered the application on time and was responsive to our needs. He was also flexible, which allowed us to make changes on the fly.”

Zoltan BodnarCFO, Yusen LogisticsGoodFirms
★★★★★
“Thank you Sahil and team for wonderful collaboration right from day 0. … Highly recommend the developers.”

Ranbeer MakinClientClient review
★★★★★
“They are always looking for new ways to improve their products and services and to deliver value to their customers.”
OFOluwatosin FalolaSenior .NET Developer, POOLCORPClutch
★★★★★
“I have had an excellent experience working with QServices. We have a highly collaborative relationship and I value them not just as contractors but as partners.”

Alex VanderElsClientClient review
★★★★★
“Sahil undertakes every project with a high degree of professionalism. His communication style is unmatched and he is always available to resolve issues or just discuss the project.”

Philmore J.ClientClient review
★★★★★
“Responsive, patient and professional. Consistent weekly attention to our project, and new ideas we hadn't asked for.”

Michael WilliamsonPresident and CEO, United Way of Southeast LouisianaGoodFirms
★★★★★
“I have been working with them on a project for a year now … They have been able to solve problems that come up with bugs or development and able to communicate well with me.”

Steven LewisClientClient review
★★★★★
“We had been working on the app for two years. QServices built it in two months.”

Brian WallerPresident, Technology Association of IowaGoodFirms
★★★★★
“All projects were delivered on time and were fully completed upon delivery.”
RBRaine Marie BuenvendiaSr. Support Specialist, Arc.DevClutch
★★★★★
“They had excellent quality. The hypercare they provided after the project went live is exceptional.”

KKKrish KishorePresident, Zero Hour ConsultantsClutch
Book Appointment
Sahil kataria (1)
Sahil Kataria

Founder and CEO

amit Kumar
Amit Kumar

Chief Sales Officer

Talk To Sales

USA

+1 270-550-1166

flag

+1 270-550-1166

Phil J.
Phil J.Head of Engineering & Technology​
QServices Inc. undertakes every project with a high degree of professionalism. Their communication style is unmatched and they are always available to resolve issues or just discuss the project.​
Assured

Thank You

Your details has been submitted successfully. We will Contact you soon!