Key Insight By Rohit Dabra, Co-Founder & CTO Updated on September 13, 2026
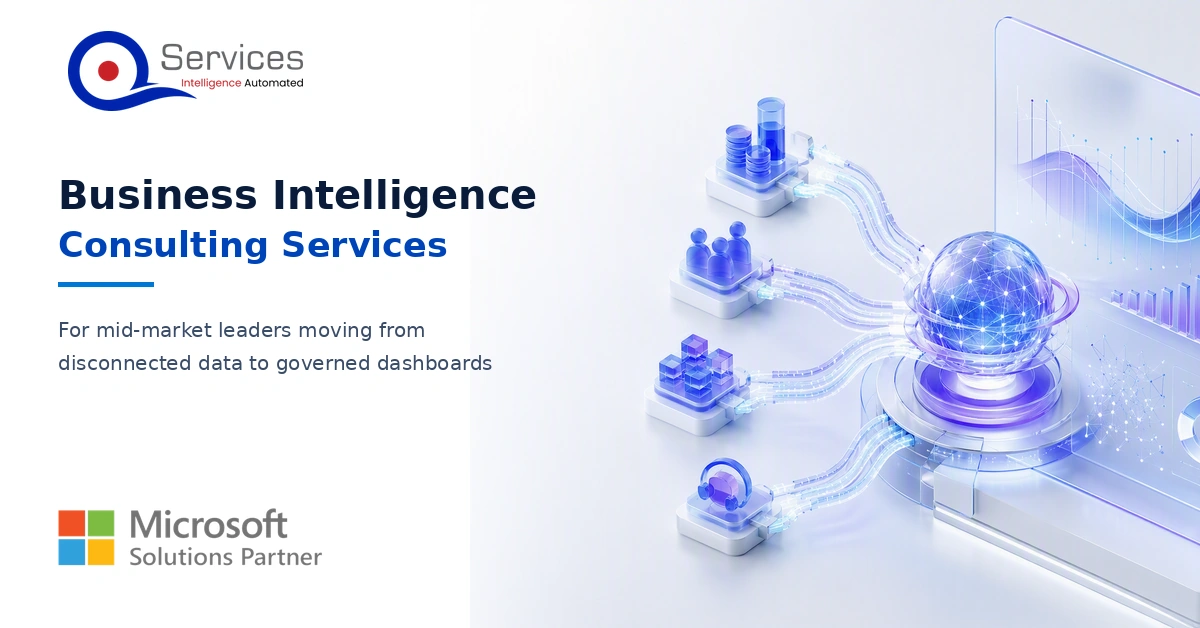
Business intelligence consulting services should give a mid-market company a governed way to make decisions. Attractive dashboards are only the visible part. The useful outcome is a system in which source data, metric definitions, access, releases, ownership, and support still work after the consultants leave.
That distinction matters when finance, sales, operations, and service teams arrive at the same meeting with different versions of revenue, margin, backlog, or customer health. The disagreement rarely begins in the visual. It begins earlier, where separate extracts, transformation steps, spreadsheet formulas, and implicit definitions turn one business question into several defensible answers. A dashboard can hide that fragmentation for a while. It cannot resolve it.
This guide gives a CIO, IT Director, or Head of Data a practical way to scope a BI engagement. It covers target architecture, reusable semantic models, managed self-service, security, gateways, controlled releases, implementation gates, adoption, and partner evaluation. The recommendations are intentionally operational. They focus on the decisions, evidence, and ownership needed to keep analytics trustworthy without forcing every report request through one central team.
In This Article, You’ll Learn
Why dashboard programs stall when the operating model remains fragmented
What a governed BI architecture should contain and where to draw boundaries
How semantic models turn approved metrics into reusable business contracts
How managed self-service balances central control with domain speed
How to test security, gateways, deployment, and production readiness
How to structure a phased engagement with explicit approval gates
What evidence to demand from a BI consulting partner before signing
In This Article, You'll Learn
Why mid-market BI stalls after the first dashboards
What business intelligence consulting services should deliver
What a governed BI architecture should contain
Semantic models are business contracts, not report by-products
Governance that enables controlled self-service
Eager to discuss about your project?
Share your project idea with us. Together, we’ll transform your vision into an exceptional digital product!
Why mid-market BI stalls after the first dashboards
The first dashboard often succeeds because a motivated analyst knows the source, the exceptions, and the people who can explain a strange number. That local knowledge masks structural debt. As more teams copy the file, add measures, change filters, and connect new extracts, the organization gains report volume without gaining a dependable analytics capability.
You can usually spot this debt in the handoffs. Each report reconnects to operational systems. KPI logic lives inside separate PBIX files or spreadsheets. A measure has a name but no named business owner. Production publishing depends on one person’s desktop process. People gain access through one-off email requests, yet nobody checks later whether they still need it. Whoever notices a refresh failure becomes responsible for fixing it.
Leadership cannot act confidently on numbers built this way. A locally correct report can still be a weak enterprise asset if another team cannot trace its source, understand its grain, test its security, recover its refresh path, or assess what will break when a shared definition changes.
Disconnected BI symptom
Governed target state
Evidence an executive can request
Each report prepares its own data
Reusable curated data and semantic models where appropriate
Lineage, model inventory, and approved reuse boundaries
Teams debate KPI formulas
Named metric owners and documented definitions
Metric dictionary with formula, grain, source, and exceptions
Publishing is manual
Defined development, test, and production path
Release runbook, approvals, tests, and rollback criteria
Access grows through one-off grants
Group-based access and tested permission patterns
Access matrix, test identities, and recertification record
Refresh depends on one operator
Owned, monitored, recoverable service
Gateway topology, recovery procedure, alerts, and escalation path
A short executive readiness review can expose the difference between reporting activity and operating capability. Can leadership name the owner of each critical metric? Can IT trace a dashboard through transformations to its sources? Can the data team identify downstream reports before changing a shared model? Can security be tested with representative identities? Can another operator restore the gateway or refresh service if the usual administrator is unavailable?
A managed portfolio is a better target than one enormous dashboard or a single model forced onto every use case. High-impact assets receive stronger controls, while local exploratory work remains possible within clear boundaries. Shared components earn reuse through ownership, test evidence, documentation, and support. An “official” label by itself proves little.
What business intelligence consulting services should deliver
A consulting scope should connect executive decisions to a durable delivery and operating model. If the statement of work begins with dashboard page counts but says little about sources, metric ownership, security, environments, deployment, support, or adoption, it prices the visible surface while leaving the harder risk unbounded.
For a mid-market organization, the engagement should produce several linked outcomes. The current reporting estate becomes visible. Priority metrics are reconciled. Architecture decisions are recorded. A reusable semantic foundation is built where reuse makes sense. Access is designed across identity, workspaces, apps, models, sources, and gateways. Releases move through a controlled path. Internal owners receive the runbooks and authority needed to operate the platform.
The scope should also say what will not be delivered. A fixed engagement can constrain source systems, domains, models, reports, pages, roles, environments, migration objects, integrations, and acceptance cycles. New requests then enter a visible backlog and change decision. Without those boundaries, a dashboard request can quietly become a data-quality program, source-system remediation, master-data initiative, and enterprise migration under the original budget.
The right first increment is usually narrow but complete. It follows one decision use case from source connectivity through transformation, semantic modeling, security, refresh, service deployment, and user acceptance. A prototype that stops at a desktop visual may prove design taste, but it does not test the production questions most likely to delay launch.
What a governed BI architecture should contain
A governed BI path separates source, preparation, semantic, consumption, and cross-cutting control responsibilities.
A governed architecture provides a clear path from source systems to decisions. Some companies need a lakehouse; others do not. Few need every Microsoft Fabric workload. The architecture still has to specify where data is prepared, where business meaning is defined, how consumers connect, and who controls each boundary.
The logical path starts with operational databases, SaaS platforms, files, and on-premises systems. Ingestion and transformation bring selected data into a usable form. A curated warehouse or lakehouse layer can be warranted when volume, history, reuse, slowly changing dimensions, or cross-source processing exceed what should live in report-level preparation. Shared Power BI semantic models then express business entities, relationships, measures, hierarchies, and security for reports, apps, Excel analysis, or embedded experiences.
Microsoft’s Power BI star schema guidance says dimension tables support filtering and grouping, fact tables support summarization, and facts should load at a consistent grain. It also advises considering a warehouse and ETL process when large data volumes or advanced concepts make Power Query preparation difficult. That supports a situational architecture decision rather than a blanket rule that all transformations belong in one tool.
Several choices deserve executive attention because they change cost, resilience, latency, and accountability. The team must choose among import, DirectQuery, Direct Lake, live connection, or composite patterns based on the actual workload. It must define acceptable data latency and source-system load. It must decide whether transformation logic belongs upstream, in a curated data product, or in Power Query. It must identify domains that need distinct ownership or regulatory treatment.
Environment boundaries matter too. Microsoft’s Fabric governance overview describes controls at tenant, domain, capacity, and workspace scope. It recommends domains to organize data by business area and capacities split by environments such as development, test, acceptance, and production for workload isolation and chargeback. Domain assignment organizes governance; it does not replace permissions.
A minimum viable governed platform can remain modest. Start with named data and metric owners, a small number of meaningful domains, a protected production boundary, reusable semantic models for shared subjects, group-based access, monitored refresh, gateway high availability where business-critical on-premises connectivity requires it, and a release runbook. Add controls as delivery scope, sensitivity, and operational impact grow.
Semantic models are business contracts, not report by-products
A semantic model is the governed layer that translates source structures into business language. It defines entities, relationships, measures, hierarchies, formats, and security so that several audiences can analyze the same approved subject without rebuilding its meaning. When each report carries its own model, the organization recreates the fragmentation it hoped Power BI would remove.
The first design question is grain: what does one row in each fact table represent? An order line, daily account balance, service ticket event, and monthly inventory snapshot answer different questions. If grain remains implicit, measures can look correct at one level and become misleading when users drill, combine facts, or filter across dimensions.
Next, separate dimensions used to filter and group from facts used to summarize, following the Microsoft star schema guidance. Define conformed customer, product, account, location, and date dimensions where shared analysis requires them. Conformance should be scoped. A customer definition for finance may legitimately differ from one used in product telemetry, but the distinction should be named rather than discovered during an executive review.
Approved KPIs need explicit measures and a metric dictionary. For each critical measure, record the business definition, formula, source, fact grain, owner, refresh expectation, allowed drill path, exception handling, and reconciliation method. A title such as gross margin is not a definition. Treatment of freight, rebates, returns, intercompany activity, late adjustments, and currency can alter the result while every report still displays the same label.
Usability affects whether governed assets are reused. Friendly names, descriptions, formats, display folders, hierarchies, hidden technical fields, and example usage reduce the need for report authors to reverse-engineer the model. Thin reports can then serve different audiences while connecting to the same approved model when their requirements share meaning and security.
Acceptance should be evidence-based. Reconcile totals to agreed systems of record. Test relationships and grain. Peer-review important DAX. Exercise refresh and failure handling. Establish a query-performance baseline relevant to expected usage. Validate row-level and object-level security. Record lineage, owner, contact, support process, and endorsement decision.
Does every fact table have declared and tested grain?
Are critical measures defined, owned, and reconciled?
Can report creators understand available fields without source knowledge?
Are refresh behavior and failure paths documented?
Have representative identities tested expected and forbidden access?
Can downstream dependencies be identified before a breaking change?
Good Microsoft data analytics consulting turns these platform mechanics into a business-owned semantic contract. Ask to inspect the model, metric dictionary, tests, and ownership records. A polished demonstration cannot substitute for them.
Governance that enables controlled self-service
Managed self-service places discipline at the shared core while domain teams retain responsibility for reports and interpretation.
Governance should define decision rights and guardrails without sending every chart to a committee. Mid-market teams often get trapped between unmanaged local reporting and a central BI queue that turns each small change into a platform request.
Microsoft’s content ownership and management guidance distinguishes business-led self-service, managed self-service, and enterprise ownership. It describes managed self-service as discipline at the core and flexibility at the edge: a centralized team owns and manages data, while business users take responsibility for reports and dashboards. A mixed portfolio is normal because an exploratory team report and a board-facing financial pack do not warrant identical controls.
Classify solutions by delivery scope, sensitivity, and business criticality. A personal exploration can stay under local ownership with clear sharing limits. A department report using a certified semantic model may use managed self-service. A regulated or enterprise-wide product may require centralized ownership, formal testing, and stronger support. Governance intensity should rise with impact.
Ownership pattern
Good fit
Primary responsibility
Main control question
Business-led self-service
Exploration and local analysis
Business creator owns data preparation and report
Where may it be shared, and when must it graduate?
Managed self-service
Domain reporting on shared data
Central team owns governed data/model; domain owns reports
Which model, security, certification, and release rules apply?
Enterprise ownership
High-impact or broadly consumed products
Central BI team manages end-to-end lifecycle
What formal assurance and support level is required?
In managed self-service, the platform and data-model team sets ingestion standards, shared-model conventions, platform settings, reusable security patterns, deployment tooling, and monitoring. Domain teams own analytical requirements, report design, interpretation, local priorities, and first-line user feedback. Metric definitions, certification, acceptance, change impact, and retirement decisions require joint ownership.
Fabric provides practical scopes for this operating model. According to the Microsoft governance overview, administrators can set tenant-wide controls and delegate selected settings to domain, capacity, or workspace scopes. Workspaces establish collaboration and content boundaries. Capacities can support compute and environment isolation. Domains align assets and delegated responsibility to business areas. Sensitivity labels, audit capabilities, metadata scanning, lineage, and monitoring support visibility and control, but none of them replaces authorization.
Endorsement also needs a process. Microsoft’s endorsement documentation lists Promoted, Certified, and Master data states. Certification means an organization-authorized reviewer has determined that an item meets organizational quality standards and is ready for organization-wide use; only reviewers designated by a Fabric administrator can certify items. The badge should therefore follow review evidence.
A workable lifecycle might move an asset from draft to promoted for useful local reuse, then to certified after ownership, definitions, lineage, refresh, security, documentation, and support checks pass. An asset should also have a retirement path when another model replaces it. Master data designation should be used only when the item accurately represents an authoritative core data asset.
Keep the governance artifacts that settle recurring operational questions: an ownership matrix, metric dictionary, workspace standard, tenant-setting decision log, access matrix, certification checklist, architecture decision records, refresh and support runbook, release history, and exception register. If an artifact does not help resolve a decision, outage, access incident, or duplicated report, it is probably paperwork rather than control.
Power BI security cannot be reduced to row-level security. Access is the combined result of Microsoft Entra identity and group management, tenant feature controls, workspace and item permissions, app audiences and sharing, semantic-model rules, source credentials or identity, and network or gateway controls. A review must follow a representative user through all of those layers.
Microsoft’s RLS guidance is specific about scope: row-level security filters rows, not tables, columns, or measures. Object-level security is needed where model objects must be restricted. The same guidance explains that multiple RLS roles are additive, so a user receives the union of rows allowed by those roles. Overlapping roles can therefore grant more visibility than an administrator intended.
Use Entra security groups where possible instead of mapping people one by one. Prefer a clear role per user context, least privilege, and dynamic logic that returns no rows for unexpected values. Test normal users, managers, administrators, recently transferred employees, absent group mappings, and deliberately invalid role values. Record the expected result before executing the test.
On-premises connectivity introduces another production dependency. Microsoft’s gateway communication documentation says the on-premises data gateway establishes outbound connections through Azure Relay to its associated Azure region and does not require inbound ports for gateway communication. Network teams should validate current required endpoints, proxy behavior, outbound firewall rules, certificate-revocation access, TLS configuration, and the gateway’s network ports test using Microsoft’s current documentation rather than a copied static port list.
For business-critical gateway clusters, Microsoft’s planning and maintenance guidance recommends at least two gateway members, high availability and load balancing, protected recovery keys, separation of development and production workloads, and ongoing performance monitoring. That makes the gateway production infrastructure, not a utility installed under an analyst’s desk.
Assign an infrastructure owner, data-source credential owner, BI service owner, and incident escalation path. Document recovery-key custody, update testing, credential rotation, capacity and concurrency monitoring, restoration steps, and communication. The security approval package should include a permission matrix, RLS and object-level test evidence, gateway recovery procedure, network validation, external-sharing decision, and audit requirements.
Replace publish and hope with controlled releases
Development, test, and production separate experimentation, validation, and controlled consumption. When all three happen in one mutable workspace, it becomes difficult to know which version users see, whether a source endpoint was changed safely, or which evidence supports the current production state.
Microsoft Fabric deployment pipelines can move content between stages. Deployment rules can change data sources or parameter values by stage, allowing a production semantic model to use a production database instead of a test endpoint. Supported artifacts and rule scenarios can change, so the implementation team should verify current documentation against the exact items in scope.
Microsoft’s deployment process documentation calls out an easy-to-miss caveat: pipeline deployment copies content, not semantic-model data. Models need a refresh after deployment. A successful deployment message therefore says nothing about whether the production dashboard is ready for users.
A practical release workflow begins with an approved requirement or decision. The team performs model and report quality checks, deploys to test with environment rules, refreshes against test data, then executes reconciliation, performance, security, and regression tests. Shared-model changes receive an impact review. Business and technical owners approve the release. Production deployment is followed by refresh, credential and gateway checks, smoke tests, observation, and a recorded rollback decision.
Before changing a shared model, use Power BI semantic-model impact analysis. Microsoft says it identifies potentially affected workspaces, reports, and dashboards and provides usage information for downstream items. Add the result and stakeholder notification to the change gate so dependency management occurs before republishing.
Deployment history is useful but incomplete. Keep the linked requirement, decision record, test evidence, approvers, exceptions, release timestamp, owner, support handoff, and rollback criteria. Auditability comes from that combined record, not from a pipeline icon alone.
A phased BI implementation roadmap
A fixed-scope BI engagement can use five approval gates to retain evidence and ownership as work moves toward production.
A useful roadmap makes uncertainty visible early, builds a narrow production-intent slice, and expands only after important assumptions have been tested. The following structure can fit a fixed-scope engagement without pretending every data problem has a predictable answer on day one.
Phase 0: Executive alignment and scope boundary
Define the business decisions the product must support, target users, critical KPI candidates, source systems, latency expectations, security needs, dependencies, and non-goals. Acceptance criteria should measure whether the use case works and can be operated. Avoid unsupported savings or ROI promises. Deliver a charter, in-scope and out-of-scope matrix, prioritized use case, assumptions, risks, and success measures.
Phase 1: Discovery and current-state assessment
Inventory reports, spreadsheets, models, workspaces, refresh schedules, gateways, owners, source systems, permissions, and support pain points. Trace the most important reports back to their data and identify duplicated KPI logic. Reconcile the highest-risk definitions first. Deliver a report and source inventory, dependency map, maturity assessment, issue register, and prioritized remediation backlog.
Phase 2: Architecture and governance design
Decide target layers, storage and connectivity patterns, domain boundaries, ownership modes, workspace conventions, environment separation, access patterns, gateway topology, monitoring, endorsement, and release path. Record alternatives and consequences. Deliver target architecture, architecture decision records, responsibility matrix, control matrix, environment plan, and security approach.
Phase 3: Semantic foundation and vertical slice
Build one narrow end-to-end use case using real data. Validate source connectivity, transformation ownership, declared grain, relationships, measures, refresh, RLS or object restrictions, performance, deployment, and user workflow. The output should be production-intent rather than disposable. Deliver a reusable semantic model where warranted, KPI dictionary, test evidence, lineage, and a thin report or prototype.
Phase 4: Product increment and governed dashboard
Add prioritized report pages and use cases in small increments. Demonstrate working software regularly to business and technical stakeholders. Review whether users interpret the result correctly and can act on it. Visual polish matters, but it follows meaning, security, reliability, and accessibility. Deliver the report or app, acceptance record, performance and accessibility review, and support design.
This is also how buyers should assess Power BI dashboard development services. Page production is one workstream within the engagement. Each visual should inherit approved definitions, access controls, release evidence, ownership, and a monitored data path.
Phase 5: Controlled production release
Promote through test and production with defined environment rules. Refresh, execute regression and security tests, verify credentials and gateways, smoke-test representative journeys, capture approvals, and observe the release. Deliver deployment evidence, production validation, owner acceptance, release notes, and rollback criteria.
Phase 6: Adoption and handover
Train by persona rather than giving every user the same feature tour. Publish definitions, owner contacts, support routing, and known limitations. Monitor usage, refreshes, incidents, data-quality exceptions, capacity, and gateway health. Transfer administration and operational knowledge. Deliver the operating runbook, training assets, support matrix, backlog, and a 30/60/90-day review plan.
Key Insight Deliver the operating runbook, training assets, support matrix, backlog, and a 30/60/90-day review plan.
Five human approval gates
A proposed delivery pattern can place five approval gates across those phases. Tailor the evidence and approver at each gate to the client’s operating model, data sensitivity, and release risk.
Gate 1 covers outcome and scope approval: confirm the decision use case, KPI candidates, personas, sources, constraints, non-goals, and acceptance measures.
Gate 2 covers architecture, governance, and security approval: approve target design, ownership, environments, network and gateway approach, tenant and workspace controls, and access matrix.
Gate 3 covers data and semantic-model approval: accept reconciled measures, grain, relationships, refresh behavior, security evidence, and documented data-quality exceptions.
Gate 4 covers user acceptance and release approval: resolve material demo feedback and approve usability, performance, training, support, deployment, and rollback readiness.
Gate 5 covers production and handover approval: accept production refresh and smoke-test evidence, monitoring, ownership contacts, documentation, and transferred backlog.
At each gate, retain the decision, approver, date, evidence, exceptions, and resulting change or architecture record. Human-in-the-loop governance means named people approve business meaning, risk, and release. It should not force every low-risk formatting edit through an executive committee.
Fixed scope works when boundaries are concrete. State included sources, domains, models, report pages, security roles, environments, integrations, migrated assets, test rounds, training sessions, and acceptance cycles. Route new requests through a visible decision instead of absorbing them silently or arguing about whether they were implied.
Operating model and adoption after go-live
Provisioning accounts is not adoption. Microsoft’s Fabric adoption roadmap looks beyond user counts to people, process, and technology. For a mid-market operating model, that means knowing who makes decisions, how work moves, and who keeps the platform reliable.
The executive sponsor removes cross-functional blockers and keeps priorities tied to business objectives. A BI or data product owner controls value, backlog, releases, and KPI decisions. Data owners, stewards, and subject-matter experts own meaning, acceptable use, and quality thresholds. Platform administrators manage tenant settings, capacity, monitoring, and service governance. Engineers and modelers own pipelines, curated data, models, tests, and documentation. Domain analysts build approved reports and carry user feedback. Security and network teams review identity and connectivity. Support owns triage, knowledge, and escalation.
A mid-market company does not need a large permanent department for this work. Microsoft’s Center of Excellence guidance notes that a COE need not appear formally on the organization chart; its responsibilities still need owners and priorities. A virtual COE can coordinate mentoring, office hours, standards, templates, governance advice, platform administration, escalated support, proofs of concept, architecture, and communication.
Use a cadence that matches the work. During implementation, hold regular product demonstrations and issue reviews. Review refresh and data quality on an operational schedule suited to the product. Examine usage, support demand, incidents, and capacity regularly. Review the portfolio, access, certification, and roadmap at a broader interval. Trigger impact review whenever a proposed shared-model change may break downstream items.
Measures should guide decisions rather than decorate a scorecard. Track refresh success, incident volume, time to restore, certified-model reuse, duplicate-model retirement, adoption by intended persona, unresolved data-quality exceptions, access-review completion, release rollback, training and support demand, and decision-owner satisfaction. Set baselines from the organization’s own environment instead of borrowing unsupported benchmarks.
Adoption also depends on showing users when to trust an asset, where to ask a definition question, and how to request change. Certification without owner contacts is weak. Training without a support route decays. A support queue without product ownership turns recurring data disputes into tickets instead of decisions.
How to evaluate a BI implementation partner
Evaluate a Power BI consulting company on its operating-model design as well as its dashboard work. Certifications can establish platform familiarity, but the buyer still needs evidence that the team can discover ambiguity, design controls, transfer ownership, and support a release after the demo.
Ask candidates to show how they reconcile competing KPI definitions. Request an example metric dictionary, architecture decision record, access matrix, model test, release runbook, and handover package with sensitive details removed. Ask how they decide between direct reporting and an upstream warehouse or lakehouse. Ask when they would reject a shared model, and when they would insist on one.
Security answers should cover RLS, object-level restrictions, workspace roles, Build permission, app audiences, group membership, source identity, gateways, and external sharing. Gateway answers should cover high availability, recovery keys, environment separation, monitoring, credentials, updates, and operational ownership. Release answers should include environment rules, post-deployment refresh, regression, impact analysis, smoke tests, and rollback.
Require an explicit scope matrix. It should list sources, domains, models, reports, pages, roles, integrations, environments, migrated objects, test rounds, training, documentation, acceptance cycles, and post-launch support. This is especially important when buying BI consulting services for a mid-market organization, where a small internal team may lack spare capacity to absorb undefined data cleanup or platform administration.
Question for the partner
Strong evidence
Red flag
How will you reconcile KPIs?
Named owners, workshop method, dictionary, and acceptance evidence
Definitions will be finalized while dashboards are built
How will you design reuse?
Grain decisions, semantic-model criteria, and thin-report pattern
One model per report by default
How will you validate security?
Layered permission matrix and representative identity tests
Manual production publishing with no evidence trail
How will operations transfer?
Named client owners, runbooks, training, support, and backlog
Consultant remains the only effective administrator
A narrow end-to-end assessment can be more revealing than a generic demo. Give the candidate one real decision, one difficult source, a small set of disputed metrics, and representative security constraints. Ask for the architecture choices, unknowns, acceptance plan, and artifacts before asking for visual design.
Review relevant delivery examples, while checking that each portfolio item truly resembles your data, risk, and operating context. QServices IT’s portfolio provides a starting point for that due diligence. For a domain-specific example of analytics applied to operational decisions, read the discussion of Power BI for e-commerce inventory optimization and profitability.
Takeaway
Disconnected data becomes dependable analytics only when business meaning, ownership, access, deployment, and support become repeatable. The practical sequence is to align on decisions, assess sources and reports, design architecture and governance, build reusable semantics where appropriate, test security and connectivity, release through controlled stages, and transfer an operating model to named owners.
A skeptical buyer should ask for inspectable evidence instead of a promise of transformation: reconciled definitions, architecture decisions, access tests, deployment records, recovery procedures, approvals, and a handover the internal team can use. Those outputs help dashboards remain trustworthy as people, sources, and business questions change.
If you want to scope one production-intent BI use case, identify its governance gaps, and define explicit acceptance evidence, Book a Blueprint Call.
Key Takeaways
The first dashboard often succeeds because a motivated analyst knows the source, the exceptions, and the people who can explain a strange number.
A consulting scope should connect executive decisions to a durable delivery and operating model.
A governed architecture provides a clear path from source systems to decisions.
A semantic model is the governed layer that translates source structures into business language.
Governance should define decision rights and guardrails without sending every chart to a committee.
Co-Founder and CTO, QServices IT Solutions Pvt Ltd
Rohit Dabra is the Co-Founder and Chief Technology Officer at QServices, a software development company focused on building practical digital solutions for businesses. At QServices, Rohit works closely with startups and growing businesses to design and develop web platforms, mobile applications, and scalable cloud systems. He is particularly interested in automation and artificial intelligence, building systems that automate routine tasks for teams and organizations.
A governed engagement can include current-state assessment, source and report inventory, target architecture, metric reconciliation, semantic modeling, security design, gateway planning, dashboard development, release management, testing, adoption, documentation, and handover. The scope should state the included sources, models, reports, roles, environments, migration volume, and acceptance cycles.
Dashboard development focuses on the consumption experience. BI consulting also addresses the system behind it: data preparation, metric ownership, semantic models, identity and permissions, gateways, environments, deployment, monitoring, support, and adoption. A dashboard can be one deliverable inside a broader governed BI engagement.
Managed self-service BI is an ownership model in which a central team manages governed data and semantic models while business teams own reports and dashboards. It gives domain teams room to answer local questions while shared definitions, security patterns, and platform controls remain managed at the core.
Start with one valuable decision use case and carry it end to end through source connectivity, transformation, semantic modeling, security, refresh, deployment, and user acceptance. Use the vertical slice to test unknowns, establish artifacts and owners, and decide what should scale before expanding the report portfolio.
Evaluate the partner’s evidence for KPI reconciliation, semantic-model design, layered security testing, gateway recovery, controlled deployment, impact analysis, documentation, and knowledge transfer. Require a scope matrix and inspect sample artifacts. A polished dashboard demo alone does not show that the partner can build an operable BI capability.
Business Intelligence Consulting Services for Mid-Market Rohit Dabra | Updated on September 13, 2026 Table of Contents Facebook-f Twitter Linkedin Summarize in: Get an instant AI summary of this article OpenAI Perplexity Claude Introduction Key Insight By Rohit Dabra, Co-Founder & CTO Updated on September 13, 2026 Business intelligence consulting services should give a mid-market company a governed way to make decisions. Attractive dashboards are only the visible part.
Microsoft Solutions Partner vs Microsoft Partner Rohit Dabra | Updated on September 13, 2026 Table of Contents Facebook-f Twitter Linkedin Summarize in: Get an instant AI summary of this article OpenAI Perplexity Claude Introduction In a Microsoft Solutions Partner vs Microsoft Partner comparison, the difference is validation. A company can participate in the Microsoft AI Cloud Partner Program without holding a customer-facing Solutions Partner designation. A designated Solutions Partner
Legacy Application Modernization Strategy for Azure Rohit Dabra | Updated on September 12, 2026 Table of Contents Facebook-f Twitter Linkedin Summarize in: Get an instant AI summary of this article OpenAI Perplexity Claude Introduction A legacy application modernization strategy assigns the right treatment to each workload, then sequences the work around business value, technical evidence, and operational risk. For Azure, that means choosing among retire, retain, rehost, replatform, refactor, rearchitect,
Eager to discuss about your project?
Share your project idea with us. Together, we’ll transform your vision into an exceptional digital product!