


-
Industries
Healthcare & Compliance
Patient data systems, compliance reporting, and workflow automation for regulated environments.
- HIPAA-aware integration pipelines
- Automated compliance dashboards
- Patient workflow digitization
Logistics & Supply Chain
Real-time tracking, route optimization, and inventory visibility across your distribution network.
- ERP/WMS integration
- Automated dispatch workflows
- Supply chain dashboards
SaaS & Tech-enabled
Scale your product infrastructure, integrate third-party tools, and ship features faster with reliable ops.
- API-first architecture
- Multi-tenant infrastructure
- CI/CD and release pipelines
Banking & Financial
Secure transaction processing, regulatory reporting, and customer-facing portals for financial services.
- Regulatory reporting automation
- Secure data integration
- Customer portal modernization
- Case Studies
Featured Case Studies
Browse all case studies →Euro Truck ServiceLogistics firm automated 12 manual workflows in a single 30-day sprint
"Read case study →Ergonnex AI 360Ergonnex AI 360 is a powerful project management platform that helps IT companies manage their projects better with built-in AI-powered analytics
Read case study →PanoramikPanoramic caters to your passion for sharing photos in a social media environment.
Read case study →


Introduction
Angular applications rarely start slow.
The slowdown appears later, usually after the app reaches production and starts handling real user traffic.
Organizations often struggle with the gap between what they tested and what users experience. The app still works, but interactions feel heavier. Clicks lag. Scrolling is no longer smooth.
“It’s not broken, it just feels slow.”
That statement comes up often in mature Angular applications.
A major contributor is change detection doing more work than expected. As components grow and templates become more dynamic, Angular evaluates far more bindings per interaction. This pattern sits behind many recurring angular performance issues in large single-page applications.
Bundle growth adds another layer of pressure. Mobile devices struggle first, but the impact eventually reaches all users.
Memory issues tend to follow. Memory usage increases gradually, without alerts or crashes, until performance starts to suffer.
These problems are rarely dramatic in isolation. Together, they compound. That is what makes angular performance difficult to manage at scale.
Before applying angular performance optimization, it is critical to recognize these patterns.
How to Improve Angular App Performance Without Rewriting Everything
Performance work in Angular does not start with a rewrite. Most slowdowns in production come from a small number of repeated patterns.
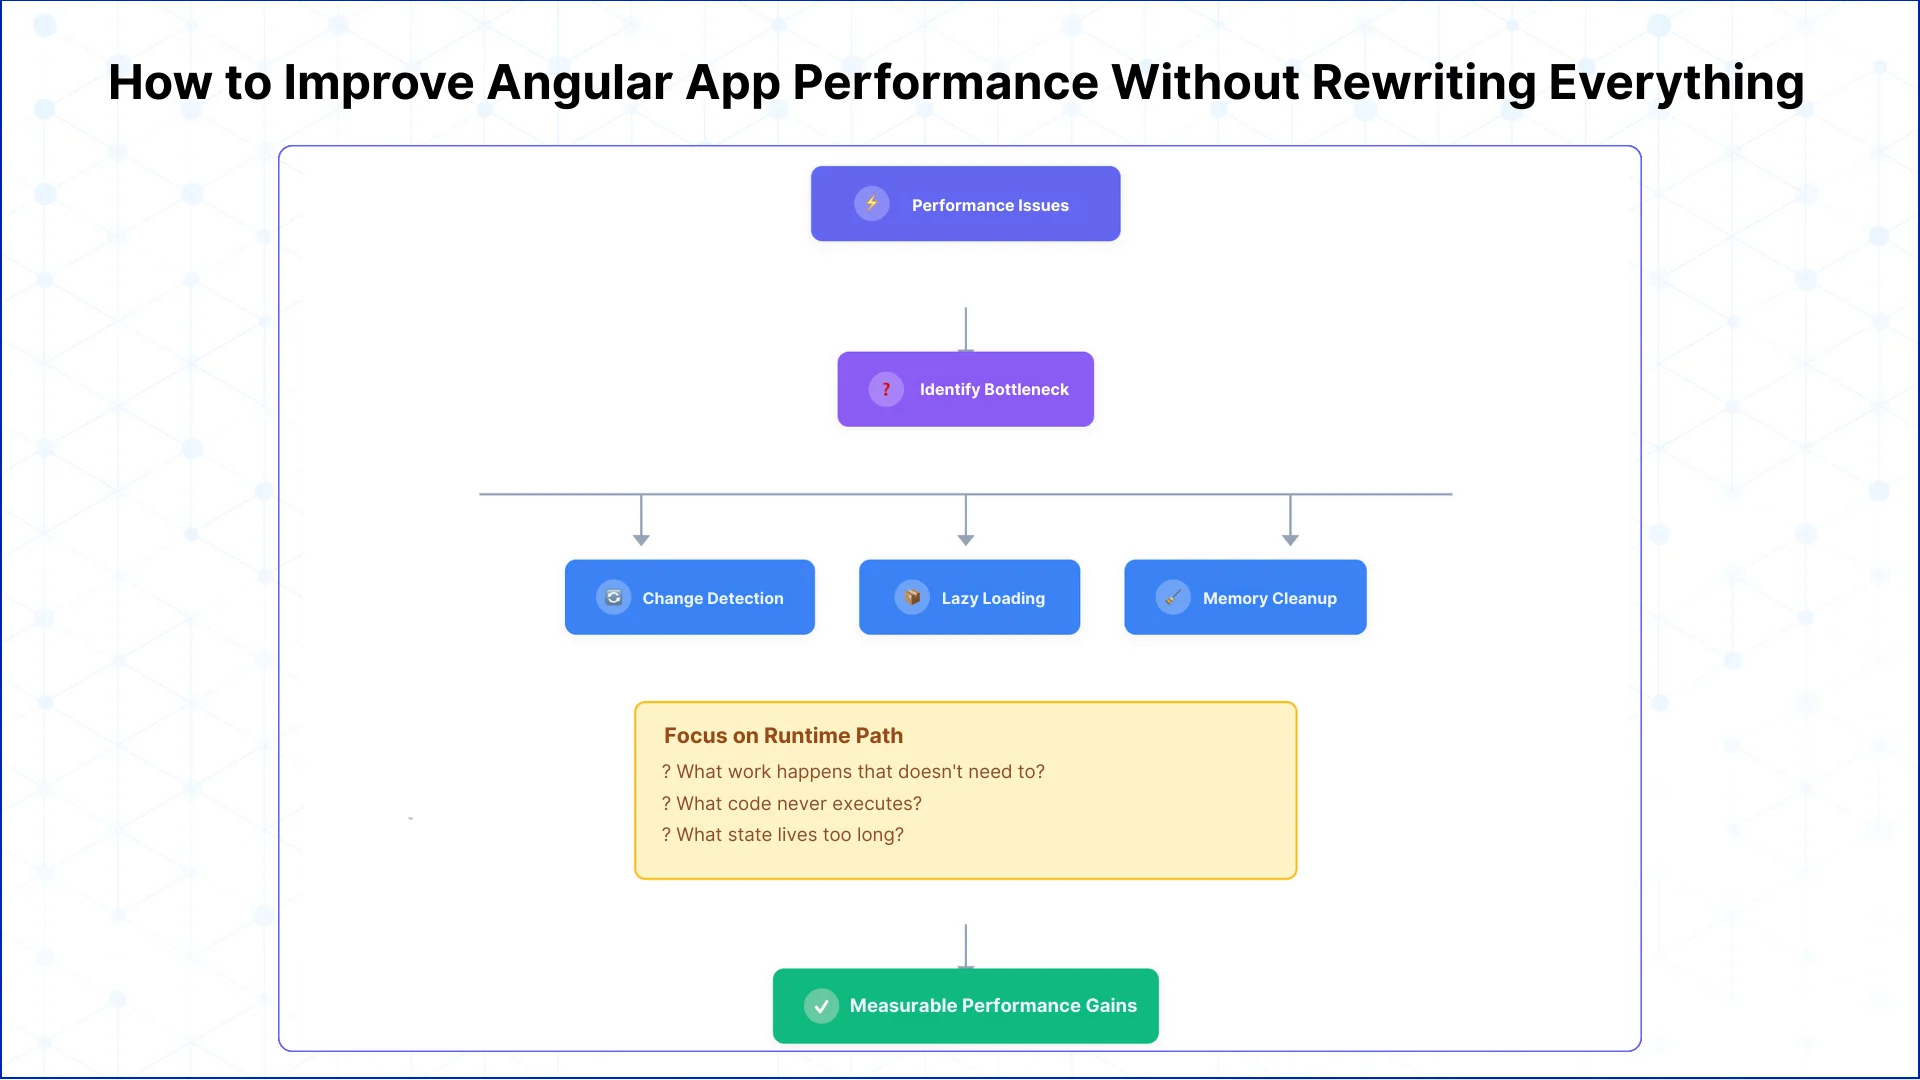
Reduce Unnecessary Change Detection Work
Angular apps slow down when the framework does more checking than the UI needs. This is one of the most effective ways to improve angular performance without refactoring features or data flows.
Control What Loads and When
Large bundles delay first interaction and make the app feel heavy. Splitting the application into smaller, lazy-loaded chunks improves angular app performance, especially on slower networks and mobile devices.
Clean Up Long-Lived State and Memory
Memory issues rarely crash Angular apps. They slow them down over time. Addressing these leaks is one of the most reliable angular slow performance fix strategies.
Focus Optimization on the Runtime Path
Effective angular optimization starts by questioning what actually runs during user interactions.
What work happens on every click that does not need to
What code ships to users but never executes
What state stays alive longer than the UI requires
When optimization targets the runtime path instead of theoretical issues, performance improvements become measurable and repeatable.
Common Angular Performance Issues Seen in Production Apps
Angular performance problems usually appear only after an application is used heavily. In production, small inefficiencies add up. Over time, they turn into visible slowdowns that affect everyday use.
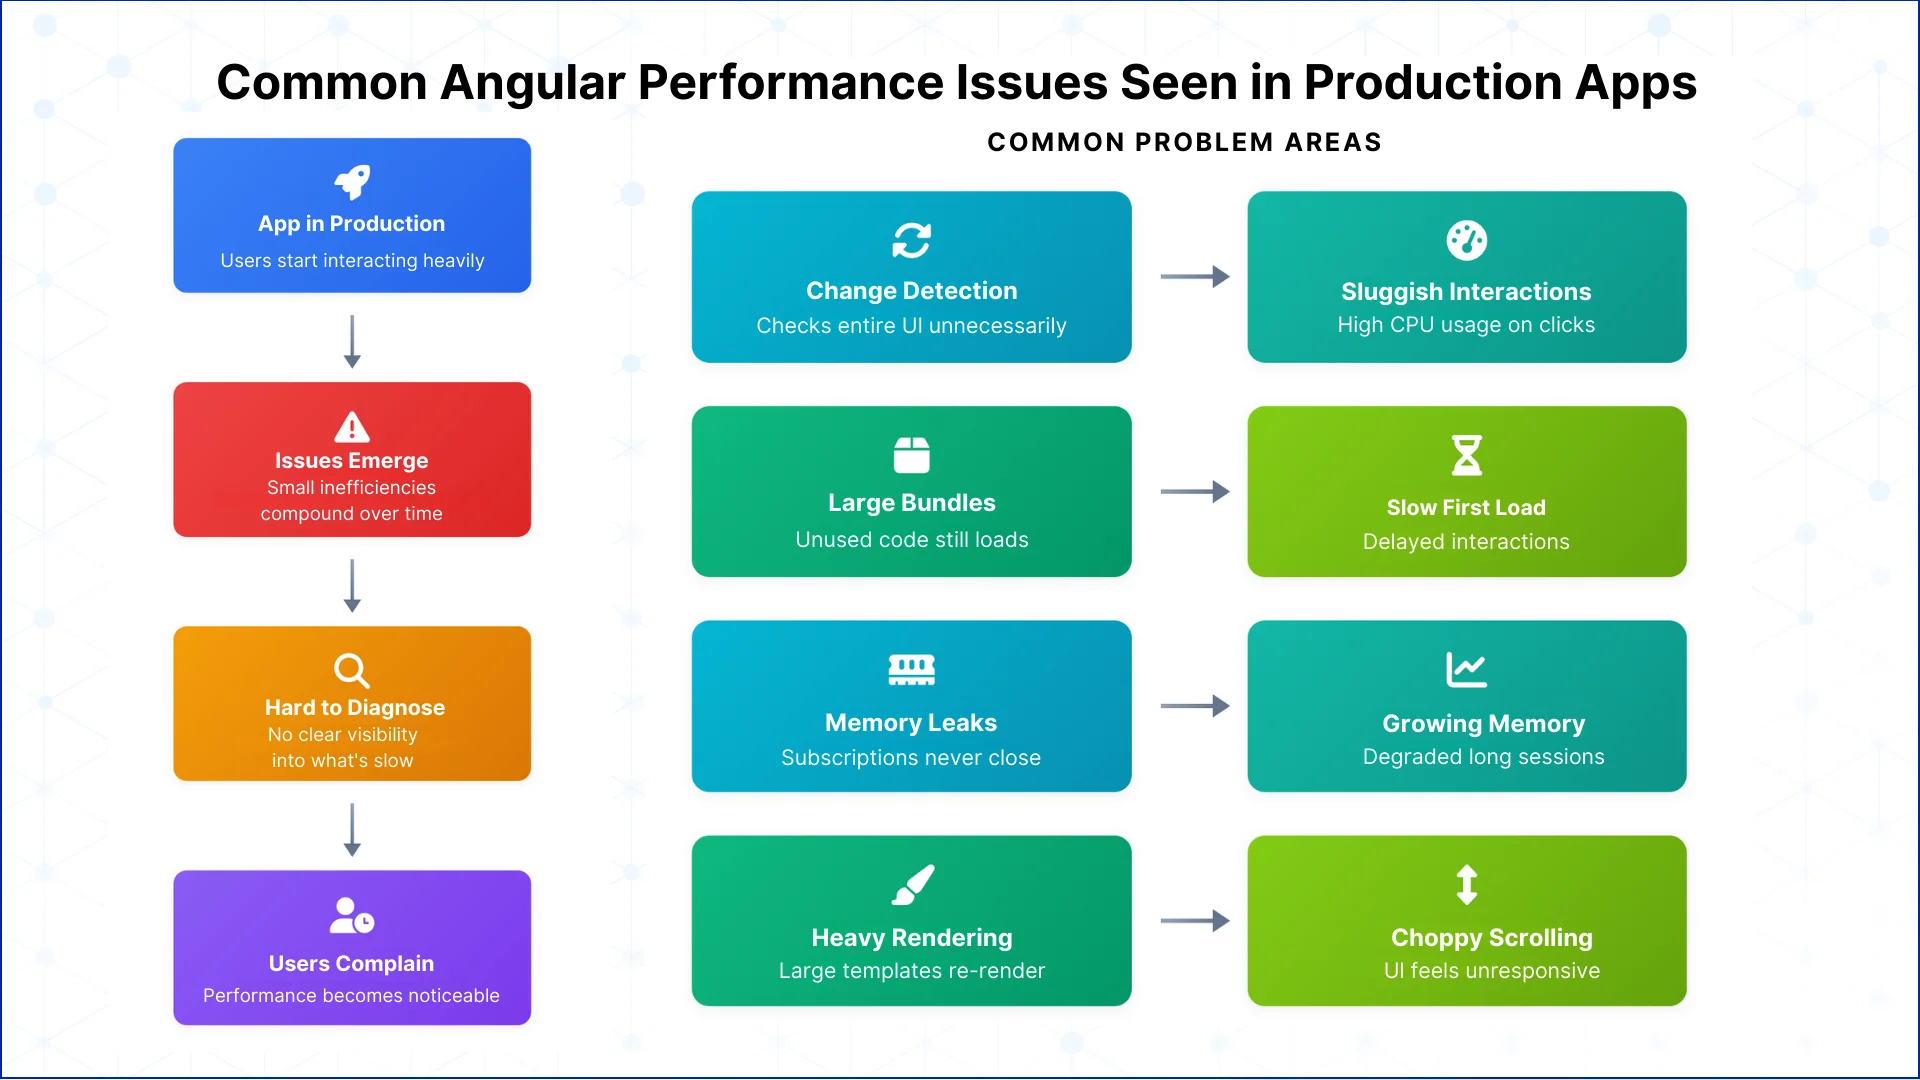
Change Detection Doing Too Much Work
One of the most frequent angular performance issues is change detection running more often than necessary. A simple click can cause Angular to re-check large parts of the UI. As the app grows, this extra work becomes expensive.
The result is slower interactions and higher CPU usage. This is often the main reason an app feels sluggish even when the data itself is small.
Large Bundles and Slow Loading
As features are added, bundle sizes grow. Code that is rarely used still gets downloaded and parsed. This delays the first interaction and makes route changes feel heavy.
This is a common angular slow performance problem, especially on mobile devices or slower networks. Users notice it before they see any UI.
Memory That Never Gets Released
Memory issues are subtle but damaging. Subscriptions stay active longer than they should. Components leave data behind after they are destroyed. Over time, memory usage increases and the browser struggles to keep up.
The app does not crash. Instead, angular app performance slowly declines during long sessions.
Too Much Rendering in the Browser
Large templates, long lists, and frequent updates can overwhelm the browser. Even small data changes can cause large parts of the UI to re-render.
This often shows up as choppy scrolling or delayed updates. The framework is doing its job, but the workload is too high.
Limited Visibility Into What’s Slowing Things Down
Many performance problems persist because they are hard to see. Logs and error tracking do not show rendering cost or interaction delays. Without clear visibility, angular performance issues remain until users complain.
Understanding these common patterns helps explain why Angular apps slow down over time. Once they are clear, performance work becomes focused and effective instead of reactive.

Angular Performance Optimization Techniques That Actually Move the Needle
Not every optimization matters. In Angular, a small set of changes usually delivers most of the gains. The goal is not to tune everything, but to reduce the work the app does during real user interactions.
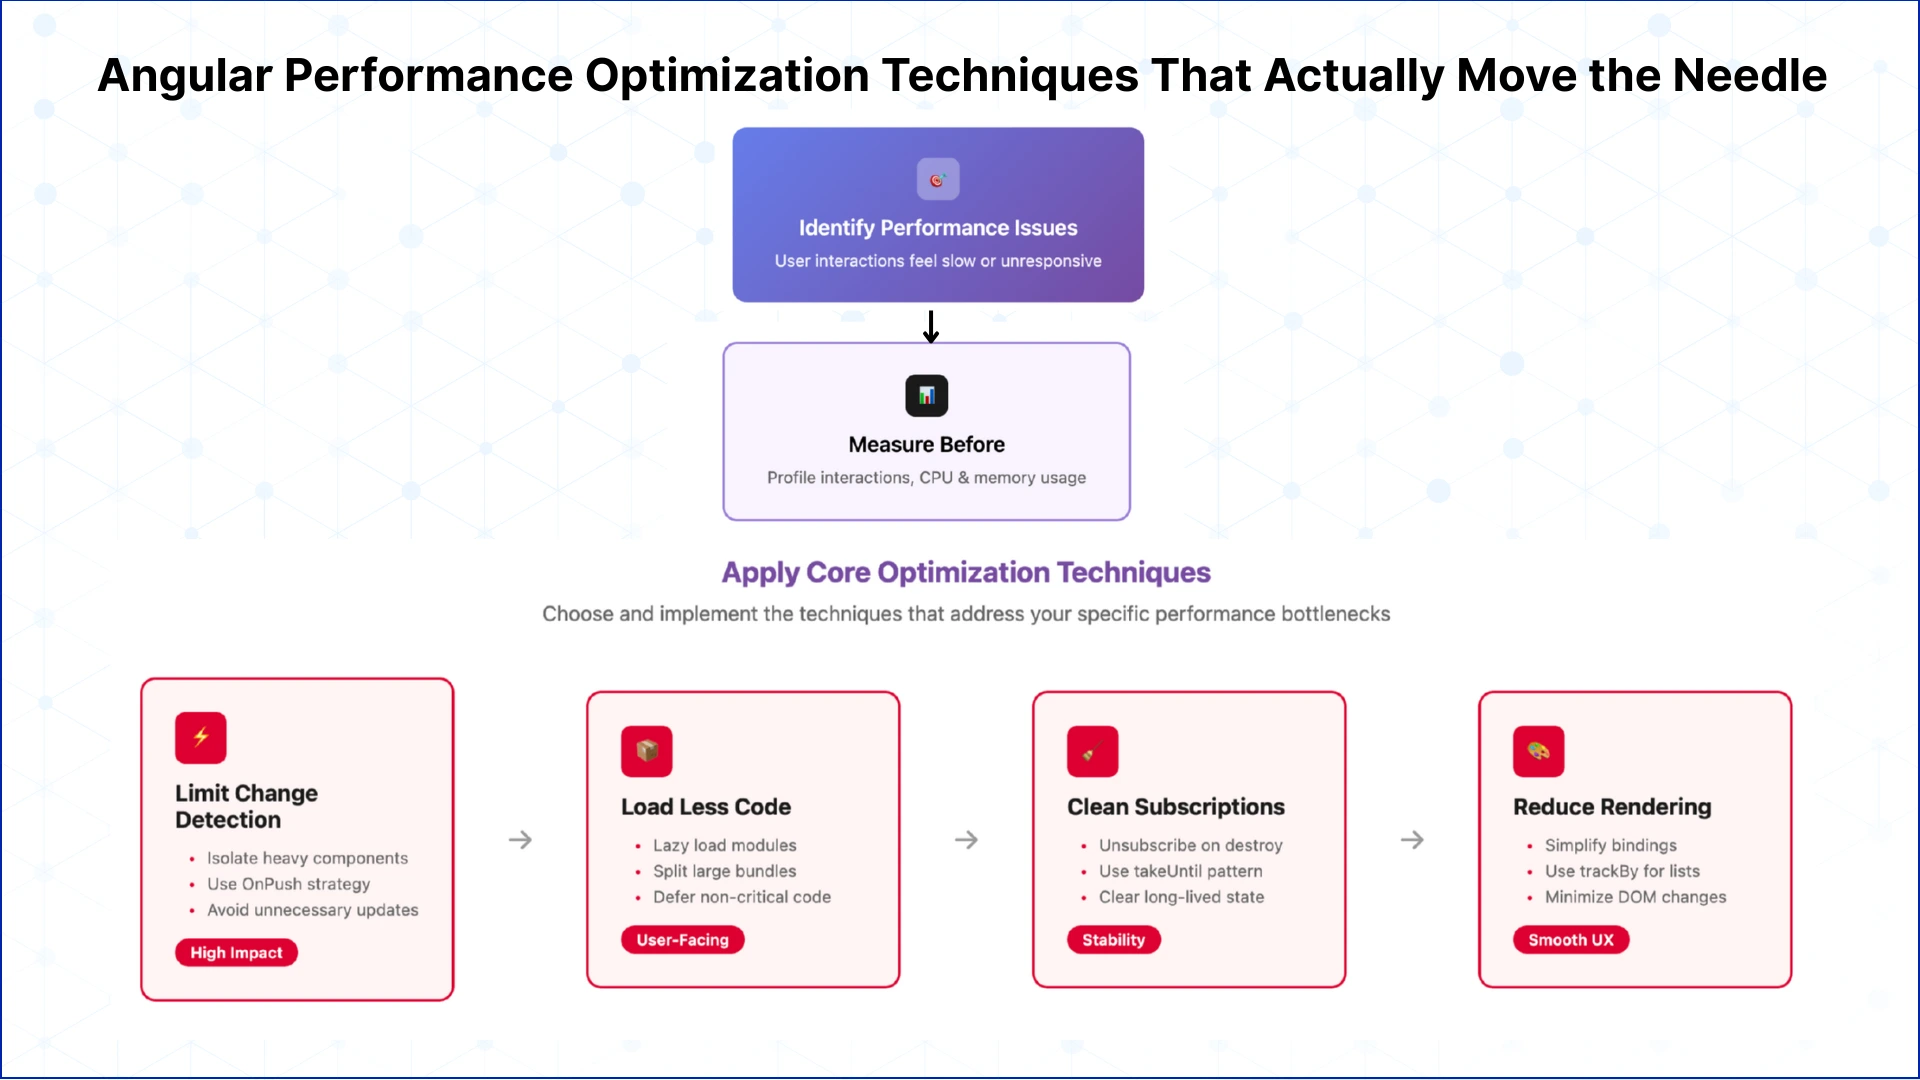
Limit Change Detection Scope
Reducing how much of the UI Angular checks on each interaction is one of the fastest ways to improve responsiveness. Isolating heavy components and avoiding unnecessary updates keeps the browser from doing extra work.
This single step often produces visible angular performance improvements without changing how features behave.
Load Less Code Up Front
Large initial bundles slow down first interaction. Breaking features into smaller, lazy-loaded modules helps users reach usable screens faster. Code that is not needed immediately should not block the app.
This is a practical angular app speed optimization approach that users notice right away.
Clean Up Subscriptions and State
Unreleased subscriptions and long-lived state quietly degrade performance. Ensuring cleanup when components are destroyed reduces memory pressure and keeps long sessions smooth.
This is one of the most reliable angular performance tuning techniques for apps used throughout the day.
Reduce Rendering Cost
Templates that do too much work slow the UI. Simplifying bindings, limiting updates in large lists, and avoiding unnecessary DOM changes lowers the rendering load.
Even small reductions here can lead to smoother scrolling and faster interactions.
Measure Before and After
Optimization without measurement leads to guesswork. Profiling interactions and watching CPU and memory usage shows which changes matter and which do not.
Effective angular performance optimization techniques are guided by evidence, not assumptions.
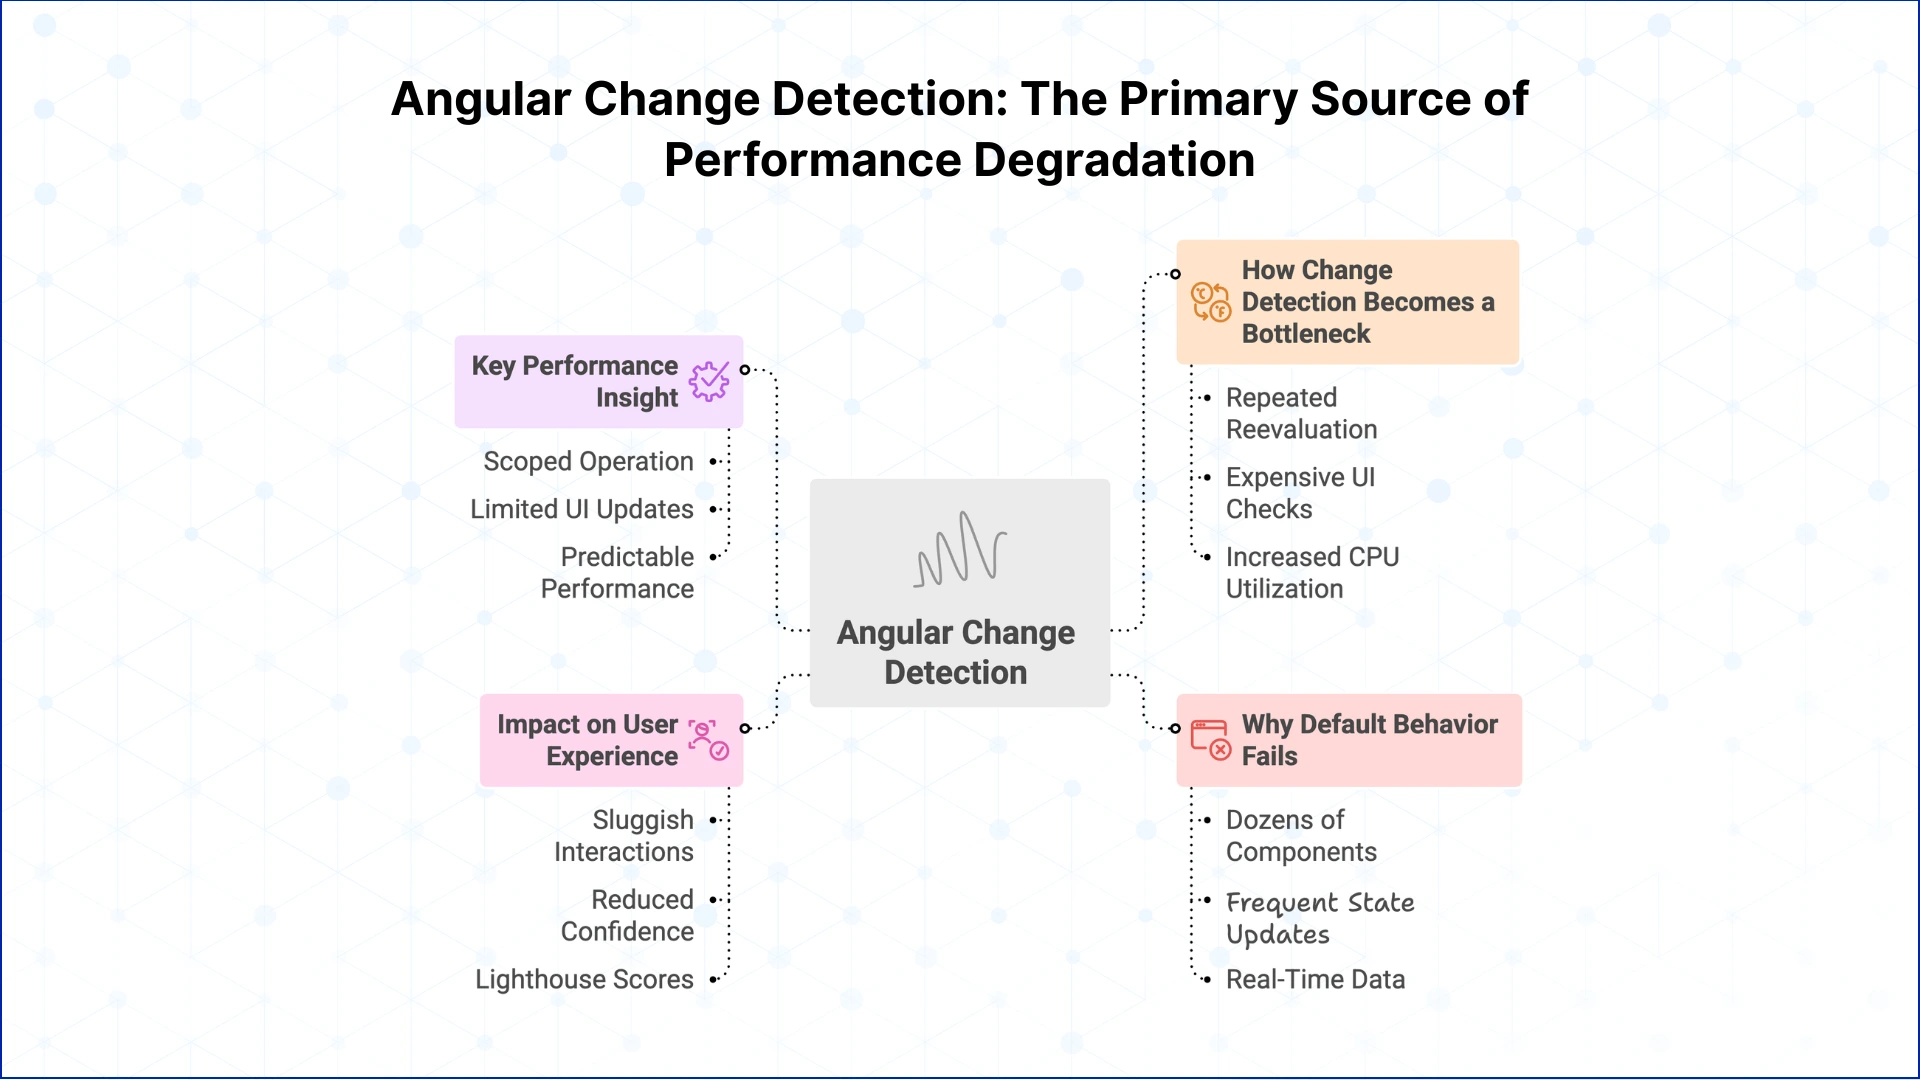
Angular Change Detection: The Primary Source of Performance Degradation
Organizations often struggle with angular performance issues only after their applications reach real production scale. Early-stage builds appear responsive, but as component counts rise and data flows become more complex, latency begins to surface across the UI.
In most mature Angular applications, performance degradation is not caused by the network or the backend. It originates in uncontrolled change detection.
 How Change Detection Becomes a Bottleneck at Scale
Angular’s default change detection strategy assumes that any event may impact the entire component tree. This design favors correctness over efficiency.
As applications grow, this results in:
- Repeated reevaluation of components that have not changed
- Expensive UI checks triggered by minor user interactions
- Increased CPU utilization during routine workflows
These symptoms are commonly misdiagnosed as rendering or API issues, when in reality they reflect inefficient UI reprocessing. This is a frequent root cause behind angular slow performance in enterprise and data-heavy applications.
Why Default Behavior Fails in Complex Angular Apps
The default change detection model works well for small and moderately sized applications. It becomes problematic when:
- Screens contain dozens or hundreds of components
- Shared services trigger frequent state updates
- Real-time data or polling is introduced
At this stage, teams trying to improve angular performance often add optimizations in the wrong places, overlooking the fact that most of the UI does not need to be checked on every event.
The Impact on User Experience and Delivery Velocity
Unchecked change detection affects more than just technical metrics.
Teams experience:
- Sluggish interactions on otherwise simple views
- Reduced confidence in UI responsiveness
- Increasing difficulty maintaining acceptable Lighthouse scores
From a delivery standpoint, performance regressions become harder to predict and more expensive to fix. This is why effective angular performance optimization must start with controlling how and when change detection runs.
The Key Performance Insight
Angular performance improves significantly when teams treat change detection as a scoped operation rather than a global one.
Limiting UI updates to components that actually depend on changing data is one of the most reliable ways to stabilize angular app performance in production.
Next, we examine concrete strategies teams use to apply this principle and regain predictable performance behavior.
Concrete Strategies to Fix Slow Angular Interactions and UI Jank
Many Angular apps load quickly but still feel slow during use. Clicks lag, scrolling stutters, and forms hesitate before responding. This usually happens because too much work runs on every user interaction.

Control Change Detection
Angular’s default change detection can re-evaluate large parts of the app on every event. In real-world apps, this leads to noticeable UI lag.
Using OnPush where possible limits updates to components that actually changed. This is one of the most effective angular performance optimization techniques for improving interaction speed.
Simplify Templates and the DOM
Large, complex templates slow rendering. Deep nesting, heavy loops, and oversized tables increase DOM cost.
Smaller, focused components are a practical angular app optimization best practice, especially for dashboards and data-heavy views.
Keep Event Handlers Lightweight
User interactions should not trigger heavy computation. Expensive logic inside click or input handlers directly impacts perceived speed.
If users feel lag, this is often the root cause of angular performance issues.
Use TrackBy for Stable Lists
Without trackBy, Angular recreates list items unnecessarily. This causes extra re-renders and visual jitter.
TrackBy is a simple angular optimization that delivers immediate gains in list-heavy interfaces.
Measure Interaction Performance
Fast load times do not guarantee a fast app. Profile clicks, scrolling, and typing using DevTools and Angular profiling.
Real angular performance tuning focuses on smooth interactions, not just bundle size.


Do you have more questions?
Have a one on one discussion with our Expert Panel
Azure AI Foundry is reshaping how enterprise teams build, deploy, and govern AI at scale, and the comparison with AWS Bedrock has become one of the defining platform decisions of 2025. If your organization runs on Microsoft 365, Teams, or Dynamics 365, or if you're

React Native is a cross-platform framework built by Meta that allows development teams to write a shared JavaScript codebase and deploy to both iOS and Android. For enterprise architects evaluating mobile strategy in 2025, the choice between react native development, Flutter, and Xamarin goes well beyond which syntax your team prefers. It touches deployment timelines, maintenance costs, existing skill sets, and how tightly the front end needs to connect to your backend infrastructure.
This post breaks down all three frameworks across performance, developer experience, enterprise support, and Azure cloud integration. By the end, you’ll have a clear picture of which framework fits your organization, and when alternatives like Power Apps make more sense than a custom mobile build.
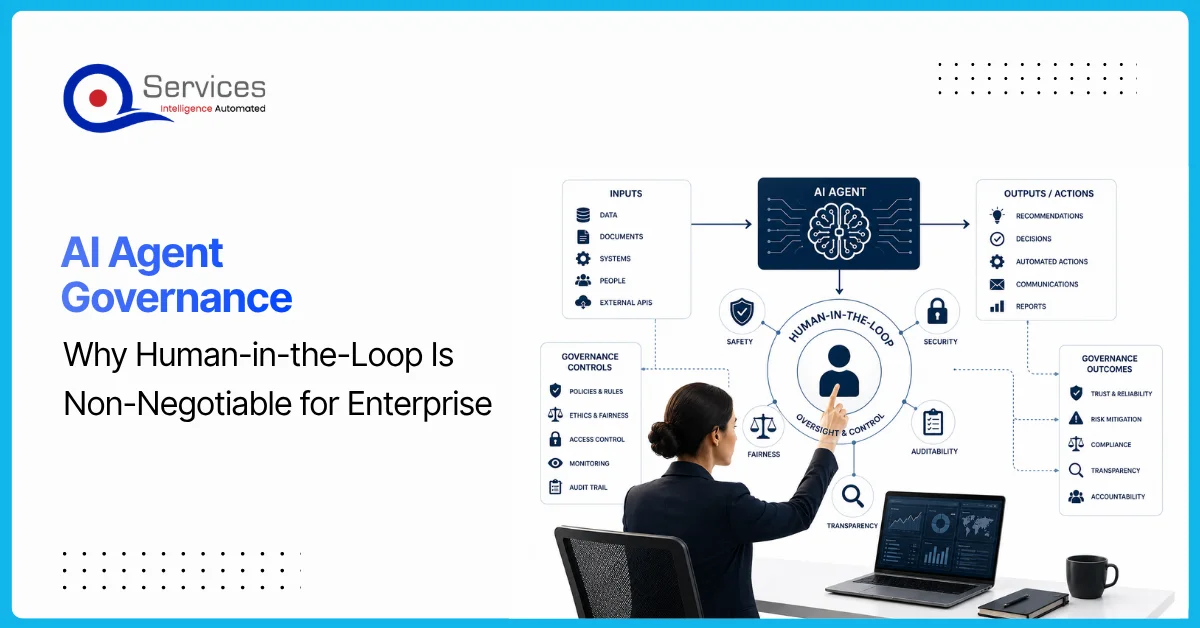
AI agent governance is the practice of establishing policies, controls, and human oversight mechanisms that determine how AI agents operate, make decisions, and interact with business systems. For enterprises deploying AI today, this isn’t optional paperwork. It’s the difference between AI that delivers measurable value and AI that creates liability.
The pressure to ship AI quickly is real. Microsoft Copilot, Azure OpenAI, and Power Platform’s AI Builder have made it easier than ever to wire autonomous agents into workflows. But “easy to deploy” doesn’t mean “safe to leave unsupervised.” Every enterprise that skipped governance in the rush to launch has eventually paid for it, whether through data leaks, compliance failures, or decisions no one can explain to an auditor.
This post covers why human-in-the-loop (HITL) oversight is non-negotiable for enterprise AI, what a real governance framework looks like, and how QServices approaches this with clients across healthcare, banking, and logistics.


Sahil Kataria
Founder and CEO

Amit Kumar
Chief Sales Officer


QServices Inc. undertakes every project with a high degree of professionalism. Their communication style is unmatched and they are always available to resolve issues or just discuss the project.
