

New Time Tracker for Azure DevOps- track developer hours directly inside work items. No ghosted hours. Learn More
logo

Your team spends hours compiling data that should take seconds to access. 

Most teams have data in CRMs, ERPs, spreadsheets, and systems that don’t connect to each other. Getting a clear picture means someone manually pulling it all together, usually hours before the meeting it’s needed for. As a Microsoft Solutions Partner with 500+ projects since 2014, we build Power BI dashboard development and analytics solutions that connect your data sources directly, so the numbers your team sees are current, not compiled. 

Hero diagram — preview
Over a decade on the Microsoft stack
014
Projects delivered
0 +
Speed increase on financial data processing for one client
0 x

Why better BI matters

Data that works.

The specific problems teams bring to us and what good business intelligence consulting actually fixes. 

Six Reasons Better BI Changes How You Make Decisions
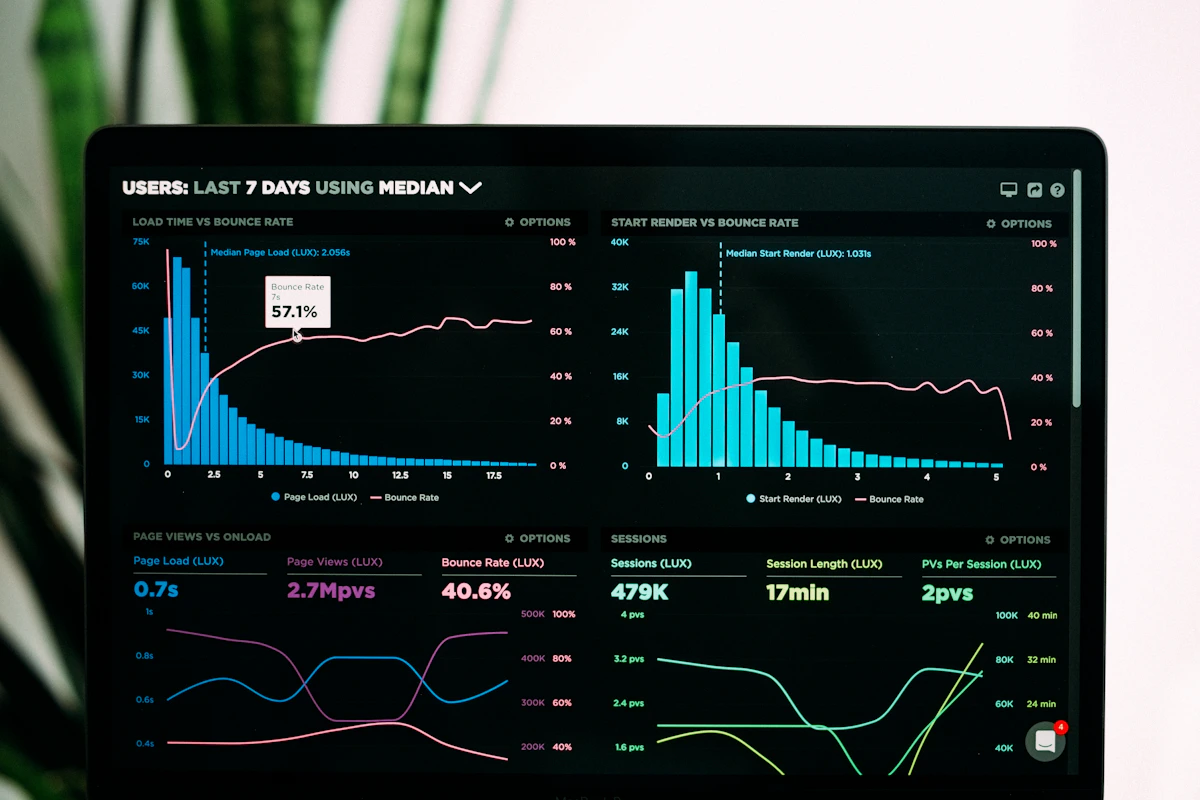
Live business analytics dashboard showing charts and performance data
Reason 01

Decisions backed by live data

When your reporting cycle means the data is already five days old by the time it reaches the person making the call, you're managing the past. Power BI consulting connects your live data sources so the number on the screen reflects what's happening now.

  • Power BI consulting
  • Live data
  • Real-time reporting
Business team collaborating around data and analytics
Reason 02

Reports built to be used

A dashboard that doesn't get used isn't a data problem. It's a design problem. We build KPI dashboard development solutions around the decisions your team actually makes, not the metrics that were easiest to pull.

  • KPI dashboard development
  • Decision-focused UX
  • Actionable reporting
Digital data storage and file management concept
Reason 03

All your data in one place

CRM in one place, finance in another, operations in a third. ETL pipeline development brings those sources into one place so your reports reflect the full picture, not whichever system someone exported from last.

  • ETL pipeline development
  • Data integration
  • Unified reporting
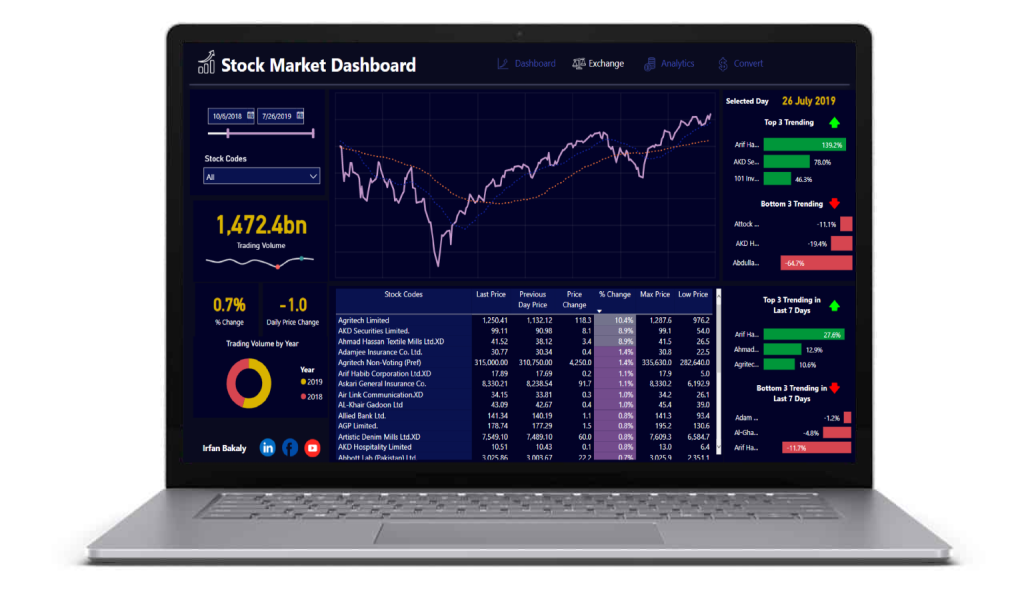
Laptop showing analytics charts and business performance data
Reason 04

BI your team can maintain

A dashboard your team can't update when the business changes isn't an asset. We build Power BI development services solutions with documentation and training so your team owns what we build.

  • Power BI development services
  • Documentation
  • Team training
Organized technology infrastructure representing connected data sources
Reason 05

Numbers with a clear source

When a number in a report can't be traced back to its source, nobody trusts it. Data governance built into the data model means every figure has a lineage your team can follow.

  • Data governance
  • Data lineage
  • Trusted metrics
Business analytics discussion with charts and decision-making data
Reason 06

Analytics built around your questions

Generic dashboards built from default templates tell you what happened. Data analytics consulting that starts from your actual business questions tells you what to do next.

  • Data analytics consulting
  • Business questions
  • Actionable insights

Six phases 

What each phase delivers

Each stop ends with something concrete. Nothing moves forward until it does. 

01
DISCOVERY

Discovery: understand the data before touching it

Before building anything, we map your data sources, understand what decisions need to be made, and identify where the data gaps are. Most BI projects fail because someone built dashboards before anyone asked what question they were supposed to answer. We ask that question first.

Data source audit Decision mapping Gap analysis Priority list
YOU LEAVE WITH
  • A map of your current data sources and their reliability
  • A prioritised list of the reports and dashboards worth building first
  • An honest assessment of what the data can and can't support right now
02
FOUNDATION

Foundation: data layer, connect before you visualise

Dashboards built on top of messy data produce confident-looking wrong answers. We build the ETL pipeline development layer first, connecting sources, cleaning data, and loading it into a structure that Power BI can query reliably. This is the part most BI projects skip and then spend six months fixing.

ETL pipelines Data modelling Azure Data Factory Source connection
YOU LEAVE WITH
  • Connected data sources feeding a clean central model
  • Documented data lineage so every number is traceable
  • A foundation that supports new reports without rebuilding each time
03
BUILD

Build: dashboards, built around decisions not metrics

Every Power BI dashboard development build starts from a question: what decision does this dashboard help someone make? We design around that, not around what the data makes easy to show. Each dashboard ships with a working demo so you see it against real data before it goes live.

Power BI DAX measures Interactive reports Real data demos
YOU LEAVE WITH
  • Dashboards your team can navigate without training
  • Reports that answer specific business questions
  • A working demo against your actual data before go-live
04
REVIEWS

Throughout the build: reviews, your team shapes what ships

Weekly check-ins with your point of contact. If a data source turns out to be less reliable than expected, or a business requirement changes mid-build, you hear it from us before it becomes a problem. The build adjusts. Nothing lands as a surprise at the end.

Weekly check-ins Requirement changes Data quality flags Open backlog
YOU LEAVE WITH
  • A weekly rhythm where changes get surfaced early
  • Visibility into every open item
  • No end-of-project surprises on scope or data quality
05
TESTING

Before go-live: testing, validated against real scenarios

Before any dashboard goes live, we test it against the edge cases your data actually produces, missing values, date range anomalies, source system outages. A dashboard that breaks the first time a data source is unavailable erodes trust faster than no dashboard at all.

Edge case testing Data refresh validation Error state handling UAT
YOU LEAVE WITH
  • Dashboards that handle real-world data conditions
  • Documented refresh schedules and failure behaviour
  • Sign-off process with your team before anything goes live
06
HANDOFF OR ONGOING

After go-live: handoff, your team runs it

We document every data model, measure, and report in plain language. Your team gets training on how to modify existing reports and add new ones without calling us. Two options after that: independent operation with a support retainer, or we stay on for ongoing Power BI consulting and development as the analytics layer grows.

Full documentation Power BI admin training Support retainer Ongoing option
YOU LEAVE WITH
  • Documentation your team can actually use to maintain and extend the work
  • Training on the admin layer, not just the end-user layer
  • The choice of running it independently or keeping us on

In production 

What we've shipped.

What we’ve actually built, not what the platform can theoretically do. 

Connect and prepare

ETL pipeline development

Data pipelines from source systems to a central model using Azure Data Factory and custom connectors

Source integration

Connecting CRMs, ERPs, databases, spreadsheets, and third-party APIs into one queryable data layer

Data modelling

Structured Dataverse or SQL data models that Power BI can query reliably across all report types

Azure Integration Services

Automated data flows between systems for real-time or scheduled data refresh

Visualise and report

Power BI dashboard development

Interactive dashboards built around the decisions your leadership and operations teams actually make

KPI dashboard development

Executive and team-level KPI tracking connected to live data with defined targets and thresholds

Custom report design

Paginated and interactive reports for finance, operations, and compliance that your team can navigate without help

Power BI implementation

End-to-end Power BI setup including workspace configuration, data gateway, and publishing pipeline

Analyse and advise

Data analytics consulting

Working with your team to define the right metrics, the right data sources, and the right report structure before building anything

Power BI consulting

Ongoing advisory on your Power BI environment: performance optimisation, new report scoping, and model maintenance

Financial analytics

Enterprise application development for financial analysis, forecasting, and scenario modelling on your own data

Business intelligence services

Full-scope BI engagements covering data strategy, ETL, modelling, dashboards, and ongoing support

Our standards 

What we don't skip.

Things that go into every engagement because we’ve seen what breaks when they don’t. 

Data quality before dashboards

We won't build a dashboard on top of unvalidated data. The first week of every engagement checks source reliability, identifies gaps, and flags anything that will produce wrong answers before anyone sees it in a chart.

Every measure documented

Every DAX measure, calculated column, and data transformation is documented in plain language alongside the report it powers. When a number looks wrong six months later, your team can trace it without calling us.

Reports designed around decisions

We ask what decision each report is supposed to support before designing it. A dashboard built around a decision is used. A dashboard built around available data gets opened twice and then forgotten.

Refresh schedules set and monitored

Every data connection has a documented refresh schedule and a failure alert. A dashboard that silently shows stale data is worse than no dashboard, because it looks current when it isn't.

Training before handoff

We don't hand over a finished product and leave. Your team gets training on the Power BI admin layer, how to modify existing reports, and how to add new data sources. The goal is that you can run it without us.

Licensing checked upfront

Power BI licensing affects what features are available and what the ongoing cost is. We check your existing Microsoft 365 licenses before scoping anything so there are no surprises when the bill arrives.

Case studies 

Real work, real numbers.

Real projects. Including what the data situation looked like before we touched it. 

Case study carousel — Elementor version preview

If one of these looks like something your team is dealing with, a 15-minute call is the right next step.

We'll tell you honestly what your data situation needs and whether we're the right fit for it.

Get a free estimate →

Before you ask

Questions we get in the first call.

What does business intelligence consulting actually involve?

Business intelligence consulting starts before any tool is opened. It means understanding what decisions your team needs to make, identifying the data sources that feed those decisions, assessing data quality, and designing a reporting structure that your team will actually use. The consulting part is what prevents you from spending three months building dashboards that answer the wrong questions. 

A single dashboard built on data that’s already clean and connected takes two to four weeks. A full Power BI implementation covering multiple data sources, an ETL layer, and several dashboards typically runs six to ten weeks. The biggest variable is data quality. Clean, well-structured data in accessible systems moves fast. Messy data spread across legacy systems takes longer to prepare than to visualise. 

Power BI consulting is specifically about connecting to the systems you already have. Power BI has native connectors for most CRMs, ERPs, databases, and cloud platforms. For systems without a native connector, Azure Integration Services or a custom ETL pipeline brings the data in. You keep your existing systems and add a reporting layer on top. 

ETL stands for Extract, Transform, Load. An ETL pipeline development project takes data from your source systems, cleans and structures it, and loads it into a central data model that Power BI queries. You need one when your data lives in multiple systems, when it needs cleaning or restructuring before it’s usable, or when you need data to refresh automatically on a schedule rather than through manual exports. 

The licence gives you the tool. Power BI consulting gives you the connected data model, the report design, the governance, and the training that makes the tool useful. Most organisations that buy Power BI without help end up with a handful of reports built by whoever had time to learn it, disconnected from the systems the business actually runs on. 

Yes for most. Power BI has native connectors for Dynamics 365, Salesforce, SAP, Oracle, HubSpot, and most major platforms. For older or custom systems, data analytics consulting includes building the connection layer through Azure Data Factory or a custom API integration. We check your specific systems in the discovery phase before committing to a timeline. 

Globally Esteemed on Leading Rating Platforms

Earning Global Recognition: A Testament to Quality Work and Client Satisfaction. Our Business Thrives on Customer Partnership

5.0

5.0

5.0

5.0

Start here

Have a business challenge? Let’s figure out the right solution.

Tell us what you’re trying to achieve, where you’re stuck, or what you want to improve. Our business development team will connect you with the right experts to understand your needs and identify the best way forward.

Our Portfolio

Explore our portfolio for success stories. Here, we spotlight case studies reflecting technology's impact, empowering businesses and individuals to achieve success.

Explore More >>

GovWins

GovWins is an all-inclusive software solution that simplifies government contract complexities. It offers an easy-to-use platform that guides businesses through the contracting…

Loan Cirrus

Loan Cirrus is your modern financial companion, reimagining the loan experience for you. It is your go-to destination for tailored loan solutions that align with your goals and dreams…

Optrax

Optrax is a mobile application that tracks employee activity based on their location. It allows employees and site managers to create and log in to accounts…

Ask Around

The project centres around an innovative mobile networking application known as “Ask Around” that seamlessly connects users with local service…

Odenza

Odenza Vacations sought to overhaul their online booking platform to tackle several key challenges. Their existing system struggled with a cumbersome booking…

Book Appointment
Sahil kataria (1)
Sahil Kataria

Founder and CEO

amit Kumar
Amit Kumar

Chief Sales Officer

Talk To Sales

USA

+1 270-550-1166

flag

+1 270-550-1166

Phil J.
Phil J.Head of Engineering & Technology​
QServices Inc. undertakes every project with a high degree of professionalism. Their communication style is unmatched and they are always available to resolve issues or just discuss the project.​

Turn the Microsoft Licenses
You Already Own Into an
AI Workplace

Join our live webinar on Sept 24 and see five
ways to automate meetings, approvals, and

document search with  tools already in your

tenant.

Assured
Thank You

Your details has been submitted successfully. We will Contact you soon!