


-
Industries
Healthcare & Compliance
Patient data systems, compliance reporting, and workflow automation for regulated environments.
- HIPAA-aware integration pipelines
- Automated compliance dashboards
- Patient workflow digitization
Logistics & Supply Chain
Real-time tracking, route optimization, and inventory visibility across your distribution network.
- ERP/WMS integration
- Automated dispatch workflows
- Supply chain dashboards
SaaS & Tech-enabled
Scale your product infrastructure, integrate third-party tools, and ship features faster with reliable ops.
- API-first architecture
- Multi-tenant infrastructure
- CI/CD and release pipelines
Banking & Financial
Secure transaction processing, regulatory reporting, and customer-facing portals for financial services.
- Regulatory reporting automation
- Secure data integration
- Customer portal modernization
- Case Studies
Featured Case Studies
Browse all case studies →Euro Truck ServiceLogistics firm automated 12 manual workflows in a single 30-day sprint
"Read case study →Ergonnex AI 360Ergonnex AI 360 is a powerful project management platform that helps IT companies manage their projects better with built-in AI-powered analytics
Read case study →PanoramikPanoramic caters to your passion for sharing photos in a social media environment.
Read case study →

Introduction
When it comes to data visualization tools, organizations face a decision that affects how teams interpret data, share insights, and respond to business shifts. Microsoft Power BI and Tableau Software dominate enterprise analytics, yet they serve different operational needs.
Power BI integrates tightly with existing Microsoft infrastructure and offers predictable licensing, while Tableau handles complex visual analysis and scales efficiently with massive datasets.
In 2026, selecting between these business intelligence tools depends less on feature lists and more on how each platform fits existing workflows, team capabilities, and data infrastructure.
This comparison examines both tools through practical business scenarios rather than abstract technical capabilities.
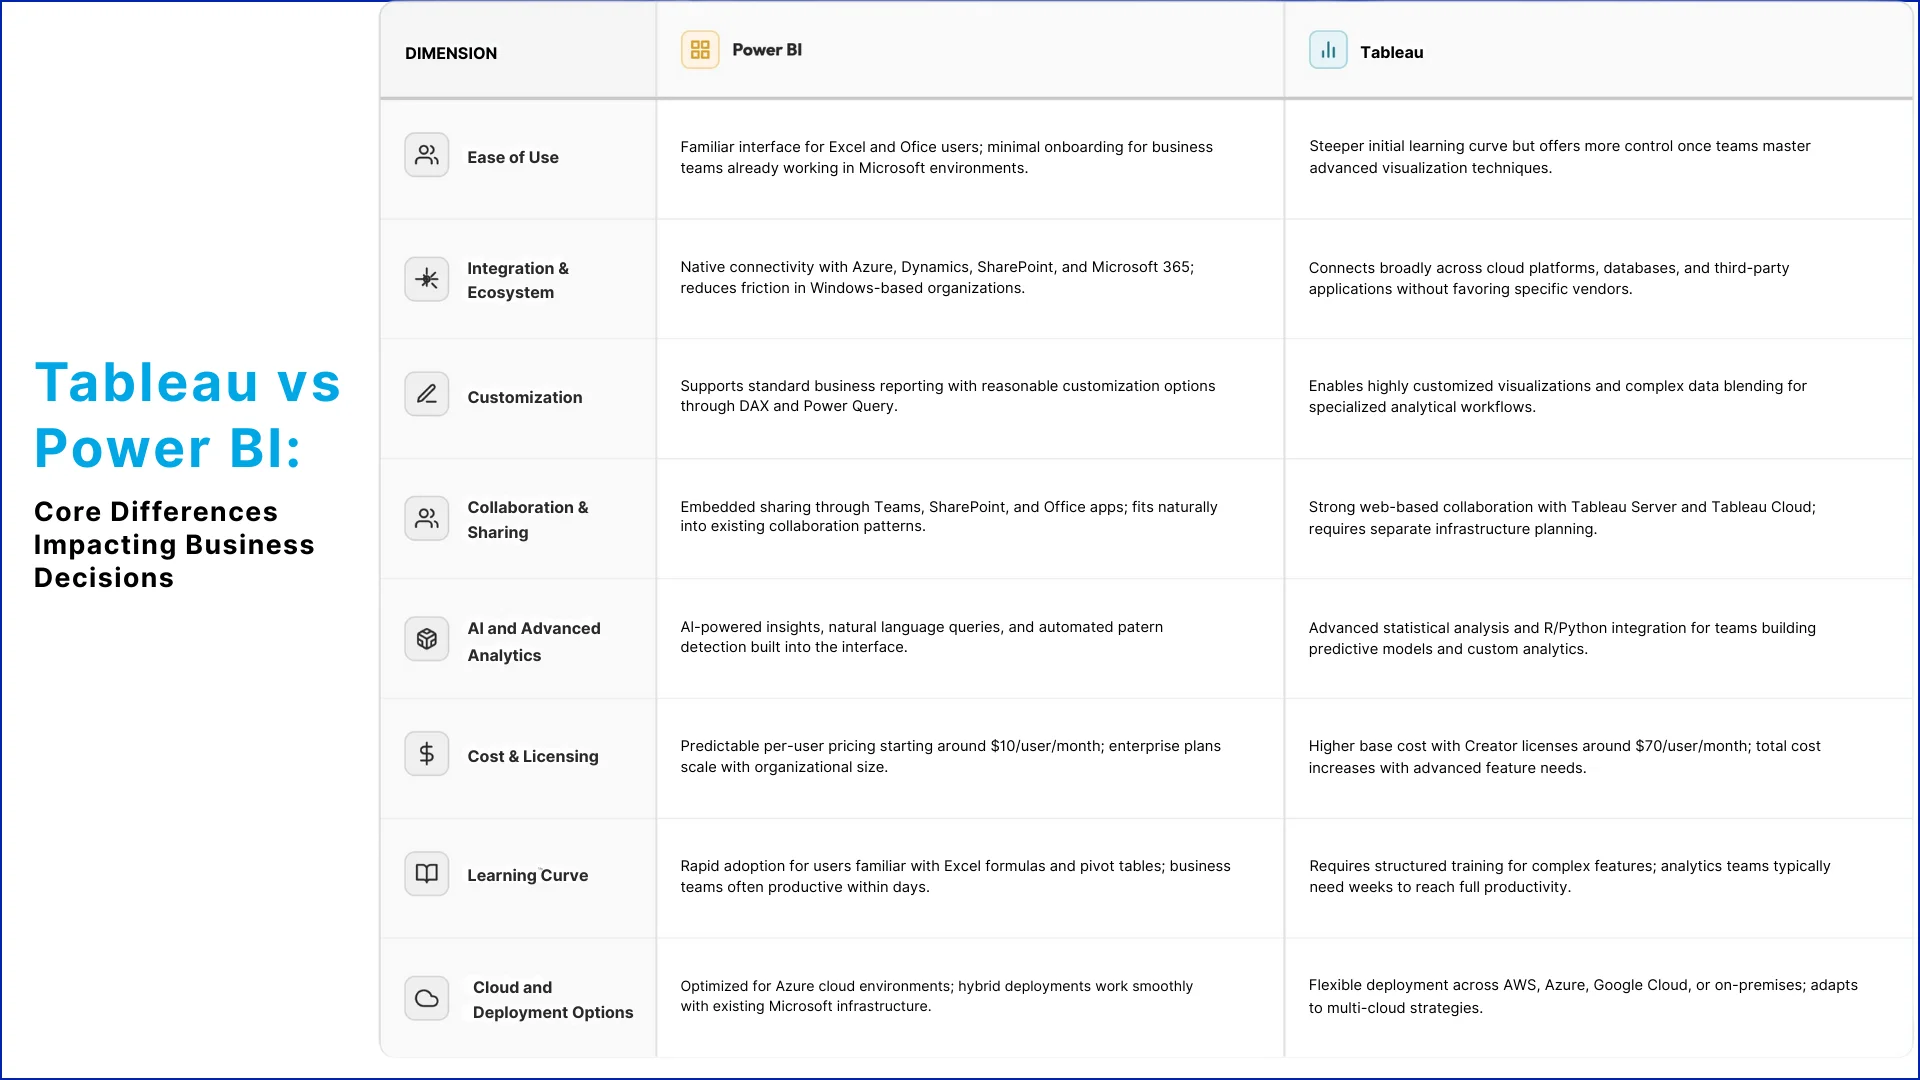
Tableau vs Power BI: Core Differences Impacting Business Decisions
Both platforms deliver enterprise-grade analytics, but their operational differences become clear when organizations evaluate them against daily workflows, existing systems, and long-term data strategies.
Feature-by-Feature Comparison of Tableau vs Power BI
While both platforms cover core analytics needs, their feature implementations vary in ways that affect daily operations and long-term scalability.

1. Data Connectivity and Source Integration
Power BI connects seamlessly to Microsoft data sources like SQL Server, Azure databases, and Excel files, reducing setup time for organizations already invested in Microsoft ecosystems.
Tableau supports over 100 native connectors spanning cloud platforms, databases, and business applications, making it easier to unify data from diverse systems without custom integration work.
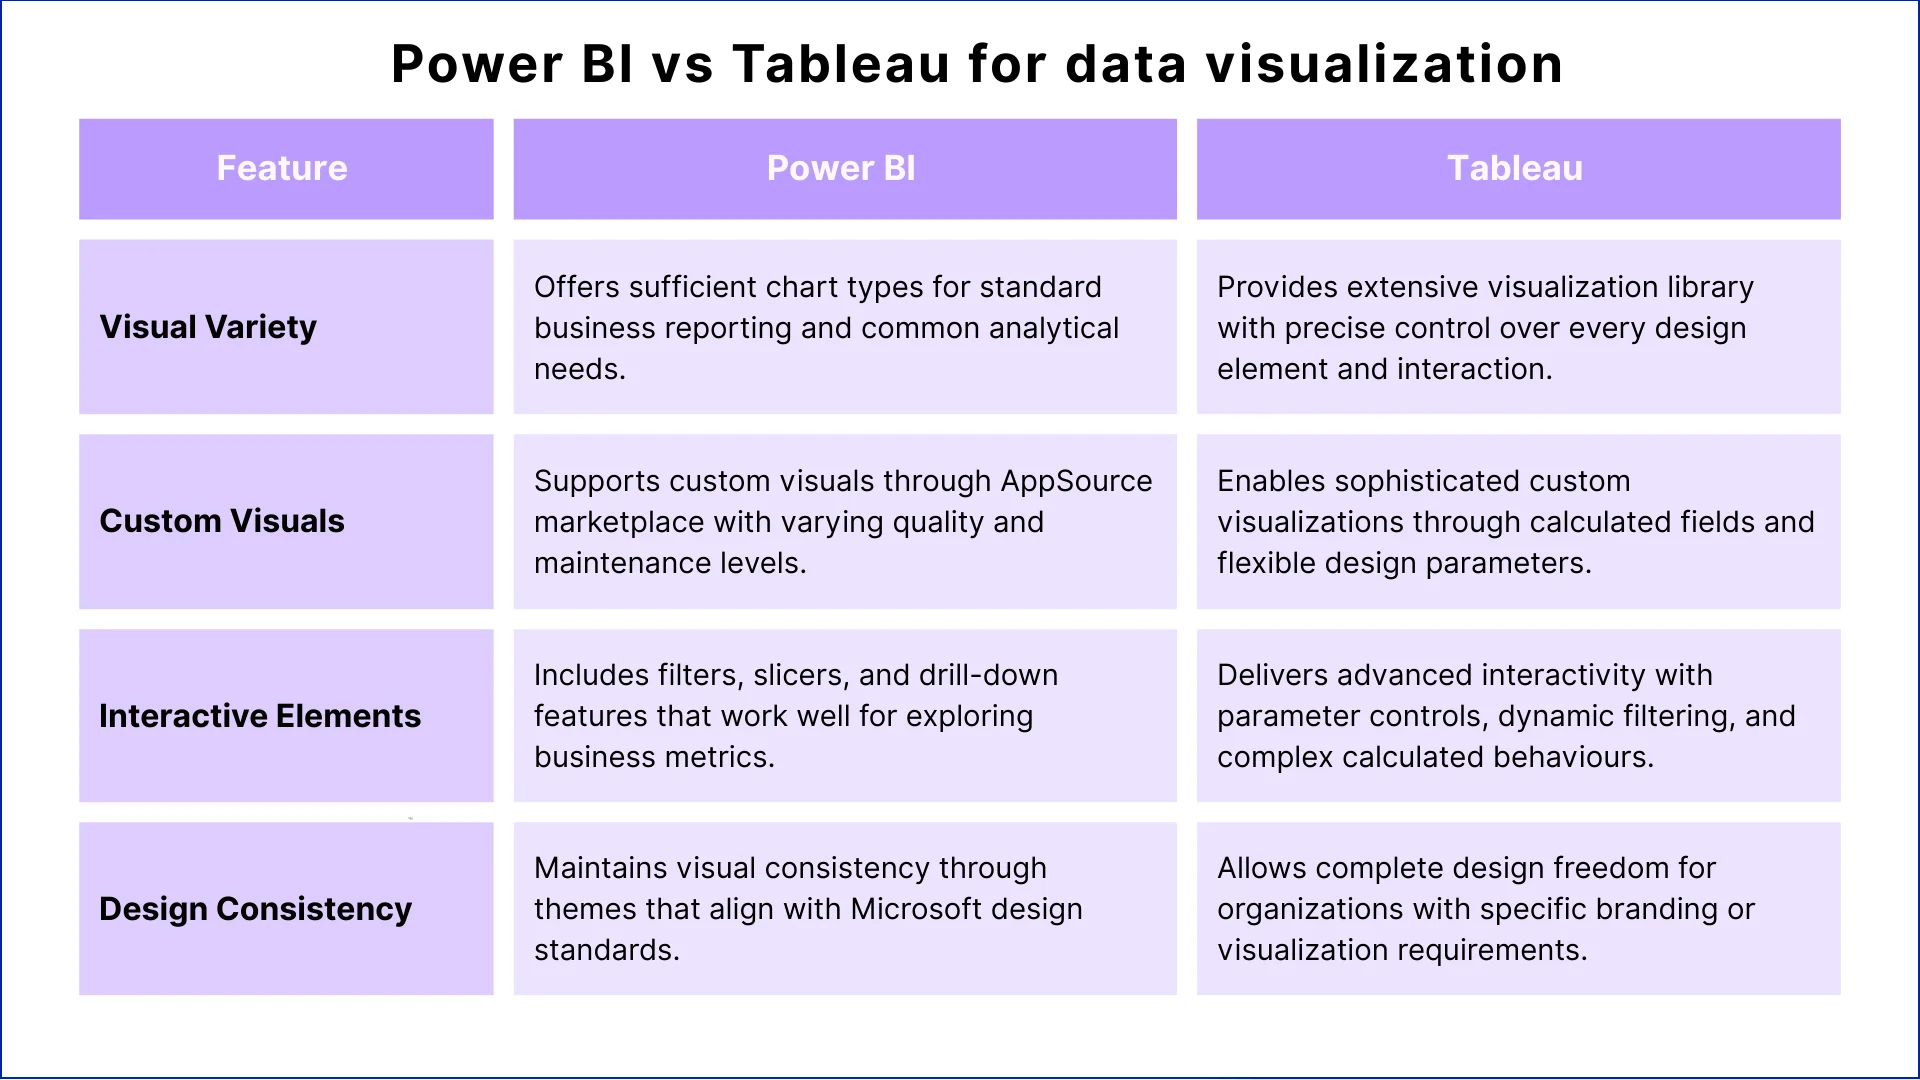
2. Dashboard Creation and Visualization Flexibility
Power BI delivers quick dashboard creation using drag-and-drop interfaces that feel familiar to Excel users, enabling business teams to build standard reports without extensive training.
Tableau excels at complex visualizations where analysts need precise control over design elements, calculated fields, and multi-layered data relationships that standard templates cannot accommodate.
3. Performance with Large Datasets
Power BI handles moderate data volumes efficiently, especially when connected to Azure infrastructure where query optimization and caching improve response times.
Tableau processes larger datasets more reliably, maintaining interactive performance even when dashboards query millions of rows or combine multiple data sources in real time.
4. Mobile Experience and Accessibility
Power BI mobile apps integrate with Microsoft authentication systems and deliver responsive dashboards optimized for phones and tablets.
Tableau mobile experiences support similar functionality but require separate configuration, though they offer stronger offline capabilities for field teams working without consistent connectivity.
5. Embedded Analytics and API Access
Power BI embeds analytics into custom applications through straightforward APIs and licensing models that align with existing Microsoft agreements.
Tableau provides robust embedding options with more granular control over branded analytics experiences, though implementation typically requires additional development resources.
6. Data Governance and Security Controls
Power BI inherits enterprise security features from Microsoft 365, including row-level security, audit logging, and compliance certifications that meet regulatory requirements.
Tableau implements comprehensive governance through centralized metadata management and data lineage tracking, which helps organizations maintain control as analytics environments grow.

Power BI vs Tableau: Use-Case Based Comparison
Across different business scenarios, each platform brings practical advantages to specific operational challenges.
Tableau vs Power BI for business analytics
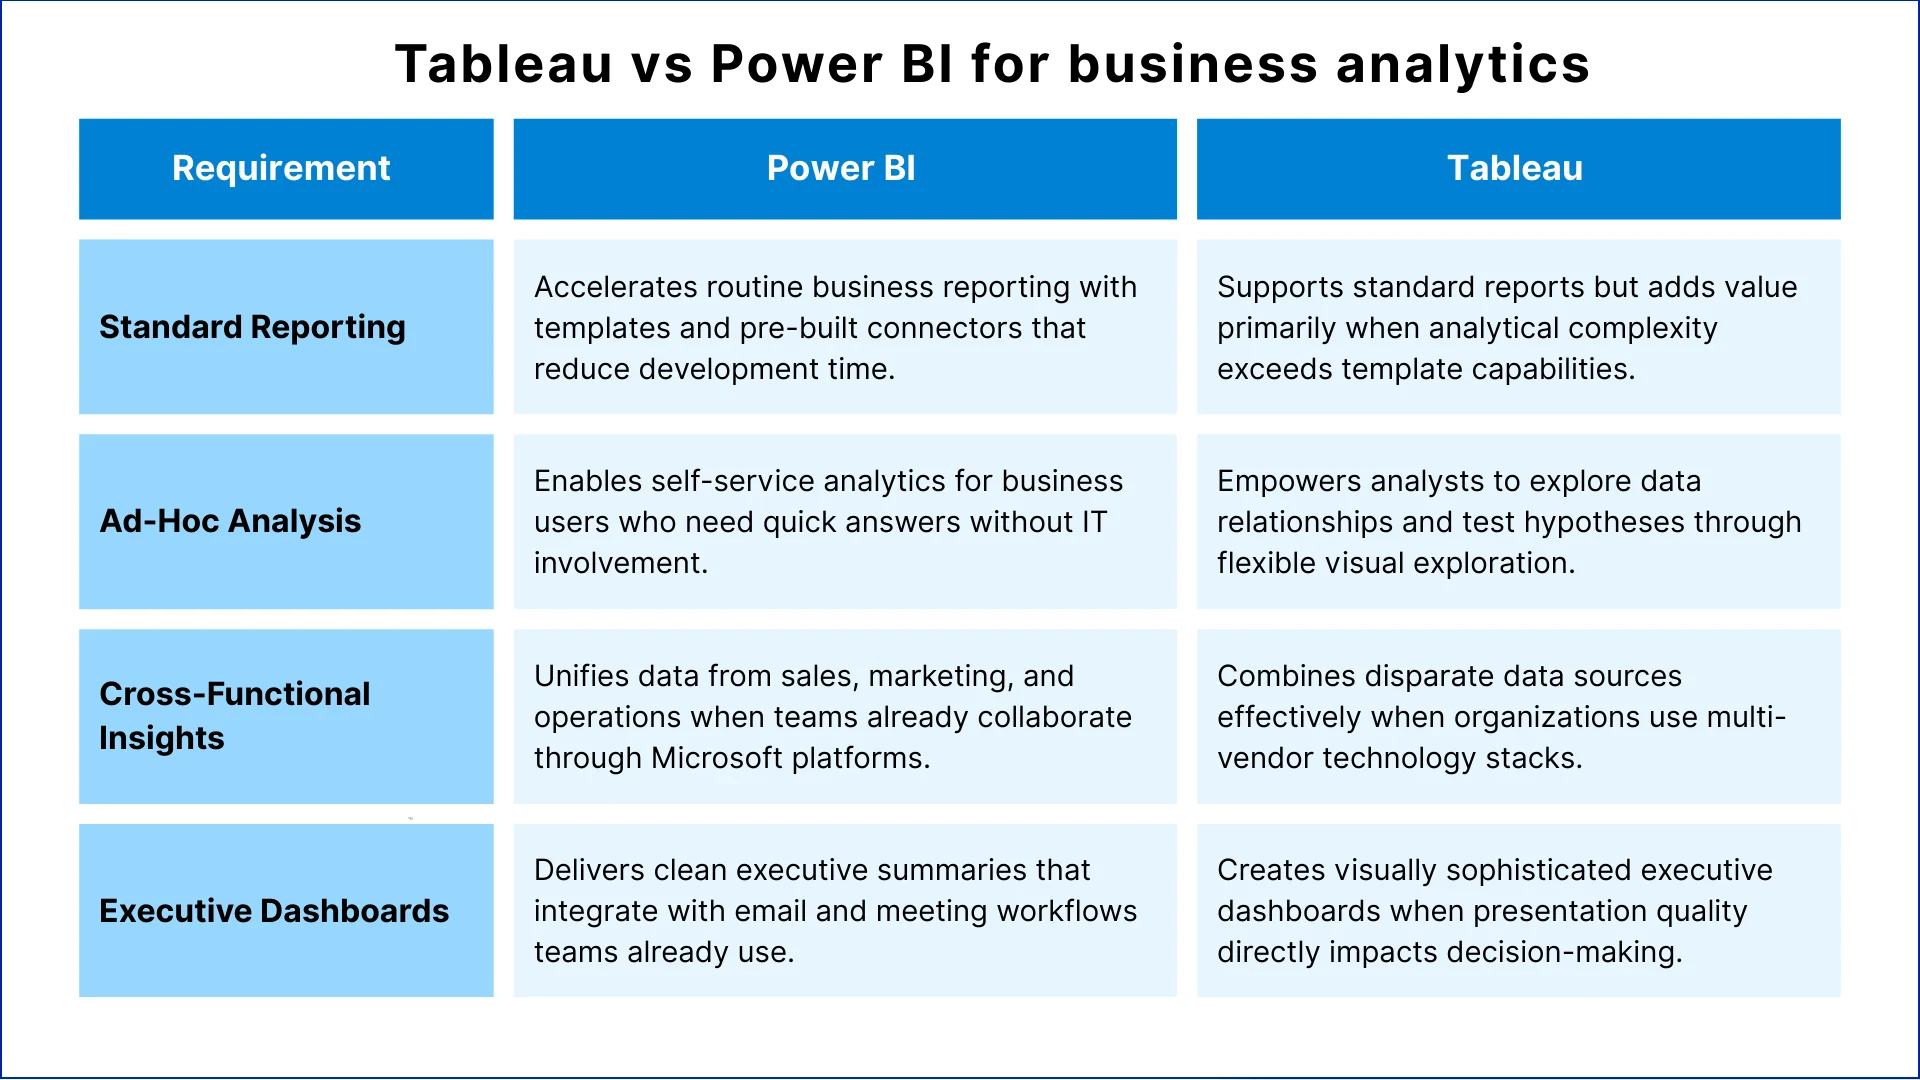
Tableau vs Power BI for large datasets

Power BI vs Tableau for data visualization
Power BI vs Tableau for financial reporting

Secondary Considerations for Choosing a BI Tool
After reviewing features and use cases, organizations must also consider practical operating factors:
1. Training and Adoption
Power BI training usually completes within 1 to 2 weeks for users familiar with Excel and Office tools. Many teams report 60–70% of users reach working proficiency without structured courses.
Tableau training often takes 3 to 4 weeks for analysts who build advanced dashboards. This time supports deeper analysis when reporting requires complex calculations and flexible visualization design.
2. Talent Pool
Around 500,000 professionals worldwide work with Power BI, especially in Microsoft-focused business environments. Many Excel users move into Power BI roles with limited retraining.
Tableau specialists number close to 200,000 globally and often earn 15–20% higher salaries. This reflects demand for expertise in complex visualization and analytical modelling.
3. Maintenance Needs
Power BI follows Microsoft’s monthly update cycle, with occasional report tuning as datasets grow. Most organizations experience stable maintenance effort after deployment.
Tableau requires more direct platform management in self-hosted environments as usage increases. Teams plan upgrades and adjust performance settings during expansion. Tableau Cloud reduces this work by shifting most system maintenance to the vendor.
4. Licensing Costs
Power BI Pro costs about $10 per user each month, while Premium capacity starts near $5,000 monthly for shared environments. A 100-user deployment typically costs $12,000–$15,000 per year.
Tableau Creator licenses cost about $70 per user monthly, with Explorer at $35 and Viewer at $15. Comparable deployments often reach $60,000–$80,000 annually.
Microsoft Power BI vs Tableau: Which is better?
Tableau vs Power BI for enterprises depends on existing infrastructure investments and the complexity of analytical requirements. For beginners, Power BI offers a gentler learning curve when teams already work within Microsoft environments.
Microsoft Power BI works better when:
- Organizations have standardized on Microsoft 365, Azure, and related services
- Business teams need self-service analytics without extensive technical training
- Budget predictability and lower total licensing costs drive platform decisions
- IT teams prefer unified security, governance, and authentication through Azure
- Standard reporting covers most analytical needs without highly customized visualizations
- Rapid deployment matters more than advanced analytical flexibility
- Teams already use Excel extensively and prefer familiar formula structures
Tableau works better when:
- Analytical complexity requires sophisticated visualizations beyond standard templates
- Organizations manage data across multiple cloud providers and database systems
- Data volumes exceed several million rows and require consistent interactive performance
- Analytics teams include specialists focused on advanced statistical analysis
- Visual presentation quality directly influences executive decision-making
- Organizations need granular control over embedded analytics experiences
- Multi-vendor technology strategies prevent deep Microsoft ecosystem commitments

How to Decide the Best BI Tool in 2026 for Your Organization

1. Check Your Technology Setup
Organizations relying on Microsoft tools, such as Azure, Active Directory, and Office applications, often implement Power BI with minimal friction. Existing security policies and user management systems reduce setup complexity.
Companies using multiple clouds or diverse databases may find Tableau’s vendor-neutral approach more compatible with their current infrastructure. This avoids forcing architectural changes and maintains flexibility across platforms.
2. Review Team Skills and Training
Teams already proficient in Excel and Office tools can adopt Power BI quickly, often with little formal training. Users gain productivity within days, which accelerates early adoption.
Tableau requires more structured training to leverage advanced visualization and analytics features. Organizations must plan onboarding and continuous skill development for analysts to fully benefit from Tableau’s capabilities.
3. IdentifyYour Analytical Needs
Power BI works efficiently for dashboards, recurring reports, and standard operational metrics. Its functionality suits organizations focused on consistent reporting and straightforward analytics.
Tableau excels when organizations analyse complex data relationships, build predictive models, or require flexible, custom analytical workflows. Its advanced capabilities support evolving business requirements that go beyond predefined templates.
4. Compare Long-Term Costs
Over three years, Power BI generally costs 60–70% less than Tableau for similar users and deployment scenarios. Lower licensing and simplified maintenance often reduce total cost of ownership for organizations with standard reporting needs.
Tableau’s higher cost reflects its advanced features and flexibility. Organizations must also consider infrastructure, training, and developer time required to extend dashboards and analytics beyond core functionalities.
5. Plan for Growth and Scale
Power BI scales effectively within Microsoft-centric ecosystems. It handles moderate data growth and is optimized for organizations leveraging Azure services.
Tableau is better suited for organizations expecting large datasets, multiple data sources, or analytical workflows that grow in complexity over time. Its flexibility ensures long-term adaptability for diverse business needs.
Conclusion
The best business intelligence tool in 2026 depends on how organizations balance immediate operational needs with long-term analytical goals. Power BI delivers faster implementation, lower costs, and smoother adoption for teams within Microsoft ecosystems.
Tableau provides stronger performance with large datasets, advanced visualizations, and flexibility for complex analytics. Neither platform universally outperforms the other.
Power BI is ideal when integration simplicity and cost efficiency are priorities, while Tableau excels when analytical depth and sophisticated visualization drive business value.
Organizations should evaluate both platforms based on workflows, infrastructure, and realistic growth projections rather than market popularity. The choice ultimately aligns with how teams work and invest in analytics.

Do you have more questions?
Have a one on one discussion with our Expert Panel
React native app development has moved from startup territory into boardrooms, and the decision your team makes about a mobile stack in 2025 will shape three to five years of product roadmap. For mid-market and enterprise businesses in healthcare, logistics, banking, and SaaS, this is

Azure cost optimisation is the difference between a cloud bill that scales with your business and one that quietly leaks budget every month. Most engineering teams discover the problem the same way: a finance lead drops a cost report, and the number is 30-40% higher

Azure AI Foundry vs AWS Bedrock: Which Enterprise AI Platform Wins in 2025? Rohit Dabra | June 17, 2026 Table of Contents Facebook-f Twitter Linkedin Azure AI Foundry is reshaping how enterprises build, deploy, and govern AI at scale. Its comparison with AWS Bedrock is


Sahil Kataria
Founder and CEO

Amit Kumar
Chief Sales Officer


QServices Inc. undertakes every project with a high degree of professionalism. Their communication style is unmatched and they are always available to resolve issues or just discuss the project.
