


-
Industries
Healthcare & Compliance
Patient data systems, compliance reporting, and workflow automation for regulated environments.
- HIPAA-aware integration pipelines
- Automated compliance dashboards
- Patient workflow digitization
Logistics & Supply Chain
Real-time tracking, route optimization, and inventory visibility across your distribution network.
- ERP/WMS integration
- Automated dispatch workflows
- Supply chain dashboards
SaaS & Tech-enabled
Scale your product infrastructure, integrate third-party tools, and ship features faster with reliable ops.
- API-first architecture
- Multi-tenant infrastructure
- CI/CD and release pipelines
Banking & Financial
Secure transaction processing, regulatory reporting, and customer-facing portals for financial services.
- Regulatory reporting automation
- Secure data integration
- Customer portal modernization
- Case Studies
Featured Case Studies
Browse all case studies →Euro Truck ServiceLogistics firm automated 12 manual workflows in a single 30-day sprint
"Read case study →Ergonnex AI 360Ergonnex AI 360 is a powerful project management platform that helps IT companies manage their projects better with built-in AI-powered analytics
Read case study →PanoramikPanoramic caters to your passion for sharing photos in a social media environment.
Read case study →


Introduction
“A tool is only confusing until you understand what problem it was built to solve.”
Are you confused about which Microsoft Power BI tool to use for reporting and why there are so many of them?
This is one of the most common questions beginners ask when they start learning Microsoft Power BI. Many users install Power BI Desktop, hear about dashboards, then suddenly come across something called Power BI report builder and feel stuck.
This confusion is normal. Microsoft Power BI is not a single tool. It is an ecosystem. Each tool inside it exists for a specific reporting need. Beginners often mix them up and try to force one tool to do everything. That leads to frustration, wrong report designs, and wasted time.
Power BI Report Builder is one of the most misunderstood tools in the Microsoft Power BI platform. It is often mistaken for Power BI Desktop or assumed to be outdated. In reality, it serves a very specific purpose that modern businesses still rely on.
This guide is written as a clear starting point for Power BI for beginners. It explains what Power BI Report Builder is, what it is not, and where it fits inside Microsoft Power BI reporting. The goal is clarity, not complexity.
This article focuses on real reporting needs like invoices, operational reports, and fixed-layout documents. If you want to understand what Power BI report builder is and when to use it, you are in the right place.
What Is Power BI Report Builder and Why It Exists
What is Power BI Report Builder
Power BI Report Builder is a standalone reporting tool used to create Power BI paginated reports. These reports are built for precision, structure, and repeatability. They are not dashboard-style reports with interactive visuals. They are formatted reports designed to be printed, exported, or shared in a fixed layout that you fully control.
A simple way to understand this is to look at intent. Power BI Desktop focuses on interactive data exploration and visual analysis. Power BI Report Builder focuses on delivering finalized, structured reports that follow strict page rules.
This distinction is essential for Power BI for beginners, because many users try to force dashboard tools to handle reporting tasks they were never designed for.
The reporting problem Power BI Report Builder was built to solve
Many enterprise reporting needs demand consistency and layout control. Finance statements, invoices, operational summaries, and compliance-style reports must look the same every time. Screen size, device type, or user interaction should not change the output.
Power BI Report Builder exists because standard interactive reports in Microsoft Power BI cannot reliably meet these page-precise requirements at scale.
Key problems it solves
- Fixed page layouts with headers and footers that repeat correctly
- Precise control over rows, columns, margins, and spacing
- Multi-page reports that grow vertically as data increases
- Pixel-perfect export to PDF and Word
- Structured export to Excel for downstream analysis
These capabilities make it a core Power BI reporting tool for operational and finance teams.
How paginated reports work in Power BI
Paginated reports are called “paginated” because they automatically generate as many pages as required to display all data rows. The report expands vertically, and page breaks occur in a controlled and predictable way when printed or exported.
This behavior is very different from scrolling reports created in Power BI Desktop, which are canvas-based and screen-dependent.
A simple example:
- One invoice per customer
- One page per invoice
- The same format whether there are 10 customers or 10,000
This is the core strength of Power BI report builder explained in practical terms.
What Power BI Report Builder is not
To avoid common beginner mistakes, clarity matters.
Power BI Report Builder is not:
- A dashboard design tool for interactive KPIs and visuals
- A drag-and-drop analytics tool like Power BI Desktop
- A full replacement for Power BI Desktop in the Microsoft Power BI workflow
- A tool for ad-hoc analysis, slicing, or rapid data exploration
It is a specialized Power BI report builder for reporting services, built specifically for structured, paginated reporting where layout control and print-ready output matter most.
How Microsoft Power BI Report Builder Is Used in Real Reporting Workflows
Beginners often approach Microsoft Power BI by learning tools one by one. In real organizations, reporting is not tool-driven. It is workflow-driven. The tool is chosen based on the final output requirement.
Power BI Report Builder appears in workflows where the report is already defined and the goal is consistent delivery, not exploration.
Where Report Builder is used in Microsoft Power BI lifecycle
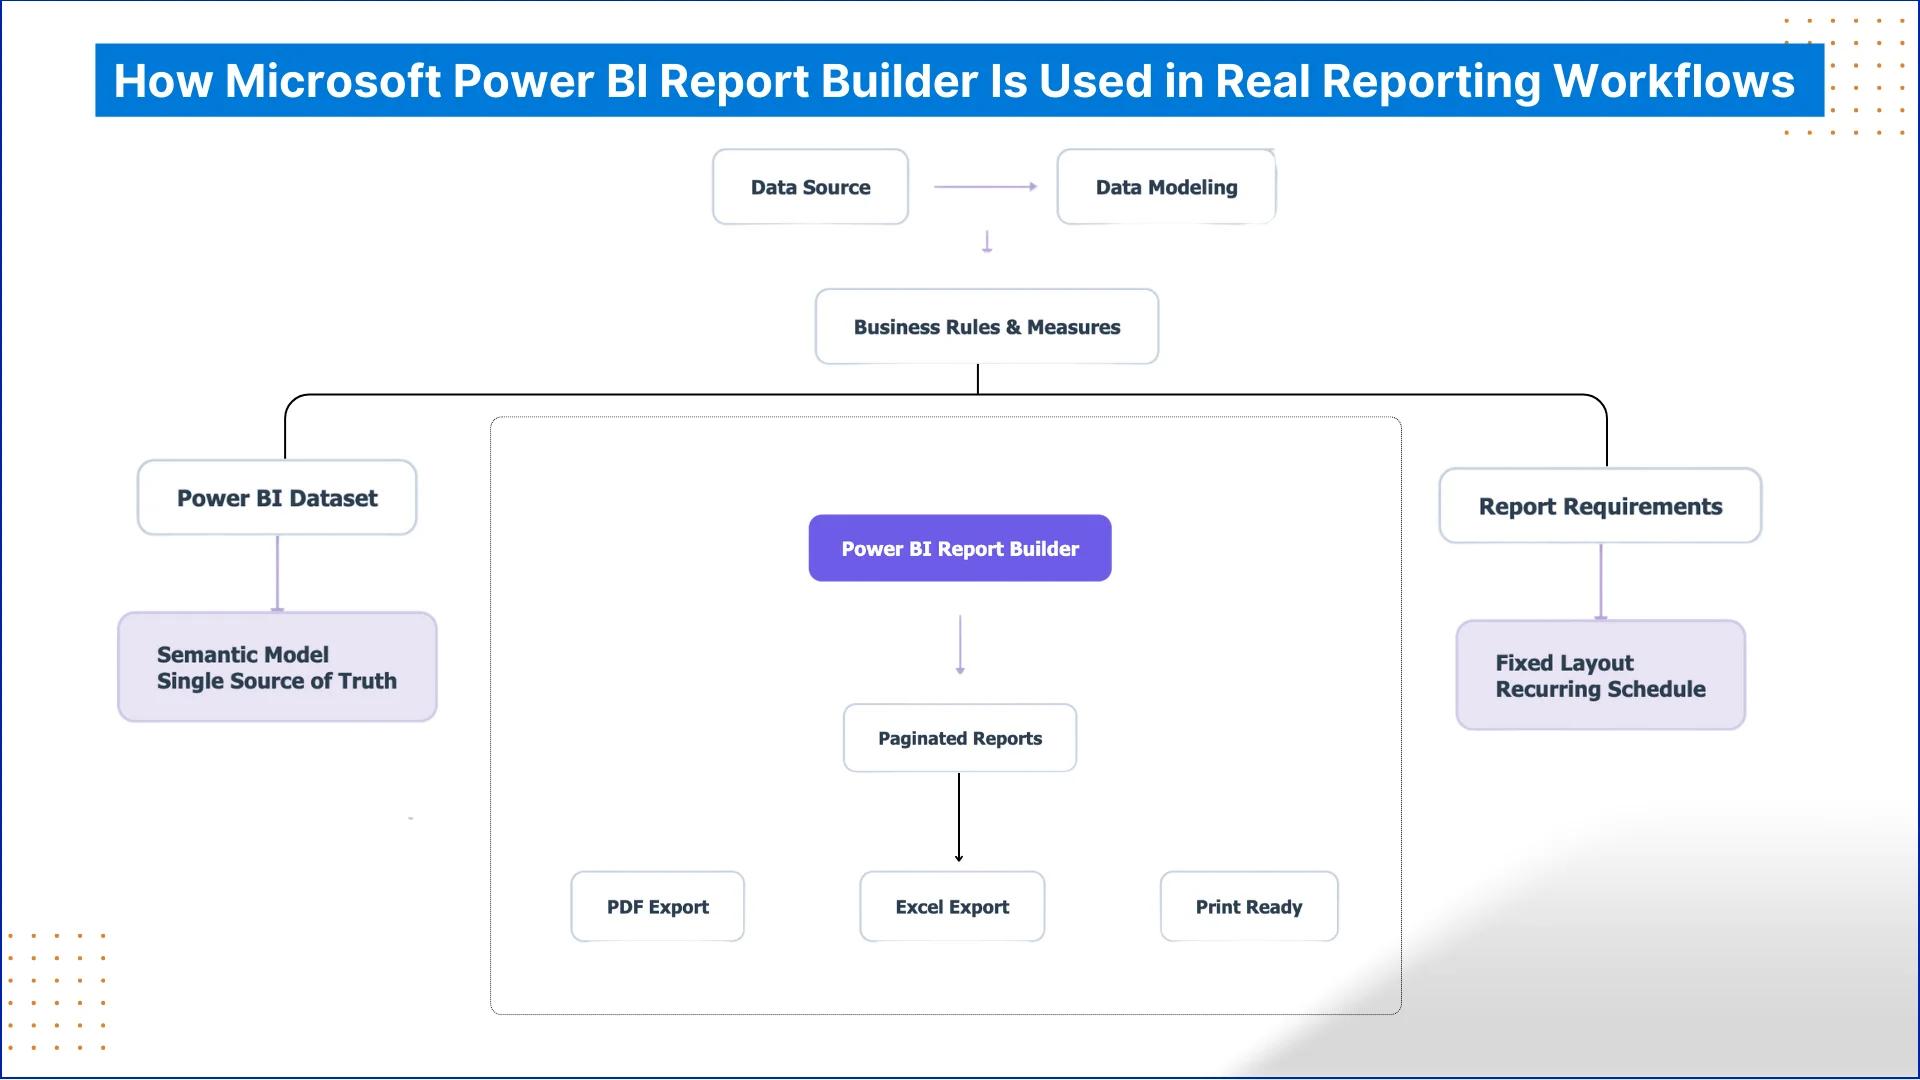
In practical enterprise reporting, the workflow usually looks like this:
- Data is modeled and prepared once
- Business rules and measures are finalized
- Reports are delivered repeatedly in the same format
Power BI Report Builder is used at the last stage of this lifecycle.
It is selected when:
- The report layout is fixed and approved
- The same report is generated every week or month
- Multiple pages must repeat reliably
- The output is consumed outside the Power BI interface
This is why it is commonly used by finance teams, operations teams, and reporting analysts.
How it connects with other Power BI tools
Power BI Report Builder does not work in isolation. It connects directly to datasets published in Microsoft Power BI Service.
This allows teams to:
- Reuse existing semantic models
- Maintain one source of truth
- Avoid rebuilding logic in multiple tools
For Power BI for beginners, this is critical. Report Builder is not a separate reporting universe. It is a specialized output layer on top of the same data model.
Why beginners misuse Report Builder
Most beginner mistakes come from misunderstanding workflow intent.
Common misuse includes:
- Using Report Builder for exploratory analysis
- Expecting interactivity like slicers and visuals
- Designing reports before data modeling is complete
Once you understand Power BI report builder as a delivery tool, not an analysis tool, these mistakes disappear.
Microsoft Power BI Desktop vs Report Builder for Beginners
A common question in any Power BI tutorial is whether Power BI Desktop and Report Builder are meant for the same purpose. Because both are part of Microsoft Power BI, beginners often assume they can be used interchangeably. In reality, they solve different reporting problems.

The confusion comes from looking at features instead of the final output.
Difference between Power BI Desktop and Report Builder
Power BI Desktop is built for interactive analysis. It is used when users want to explore data, apply filters, and uncover insights through visuals. Reports are designed for on-screen use and flexible layouts.
Power BI Report Builder is built for structured delivery. It is used when reports must follow a fixed layout every time. The focus is on formatting, page control, and clean exports for PDF or Excel, not interaction.
This is the real meaning of Power BI vs Report Builder for beginners.
A simple rule to choose the right tool
If you need to analyze and explore data, use Power BI Desktop. If you need to deliver the same formatted report repeatedly, use Power BI Report Builder. Understanding this difference between Power BI desktop and Report Builder early helps Power BI for beginners avoid layout and export issues.

How Paginated Reports Work in Microsoft Power BI
Most beginners approach Microsoft Power BI with a screen-first mindset. They expect reports to scroll, resize, and adjust dynamically. Paginated reporting requires a different way of thinking. The report is designed around pages, not screens.

In Power BI Report Builder, the page is the primary unit of design. Everything else follows from that decision. This is why paginated reports feel stricter, but also more reliable for formal reporting.
How pagination behaves at a technical level
A paginated report executes a query, retrieves the full result set, and then renders the data across pages based on layout rules. As rows increase, the report expands vertically and creates additional pages automatically. Page breaks occur where you define them, not where the screen ends.
Headers, footers, and grouped sections repeat consistently across pages. This behavior is deliberate and controlled, which is why Power BI paginated reports export cleanly to PDF, Word, and Excel.
This is a key distinction for anyone learning how to use Power BI report builder.
Practical example from real reporting
Consider a finance team generating customer statements each month. Each customer needs a separate section. Each section may run across one or several pages. The format must remain unchanged regardless of customer size.
With Power BI Report Builder, the report logic handles this automatically. One customer flows into the next. Pages repeat as needed. The layout never breaks. This is not easily achievable in standard Power BI reports.
Why paginated reports remain essential in Microsoft Power BI
Paginated reports are not legacy. They address reporting needs that interactive tools are not designed to handle. When precision, predictability, and document-quality output matter, paginated reporting is the correct choice.
Understanding this behavior is central to Power BI report builder and forms the foundation for any Power BI paginated report tutorial that follows.
Getting Started with Microsoft Power BI Report Builder
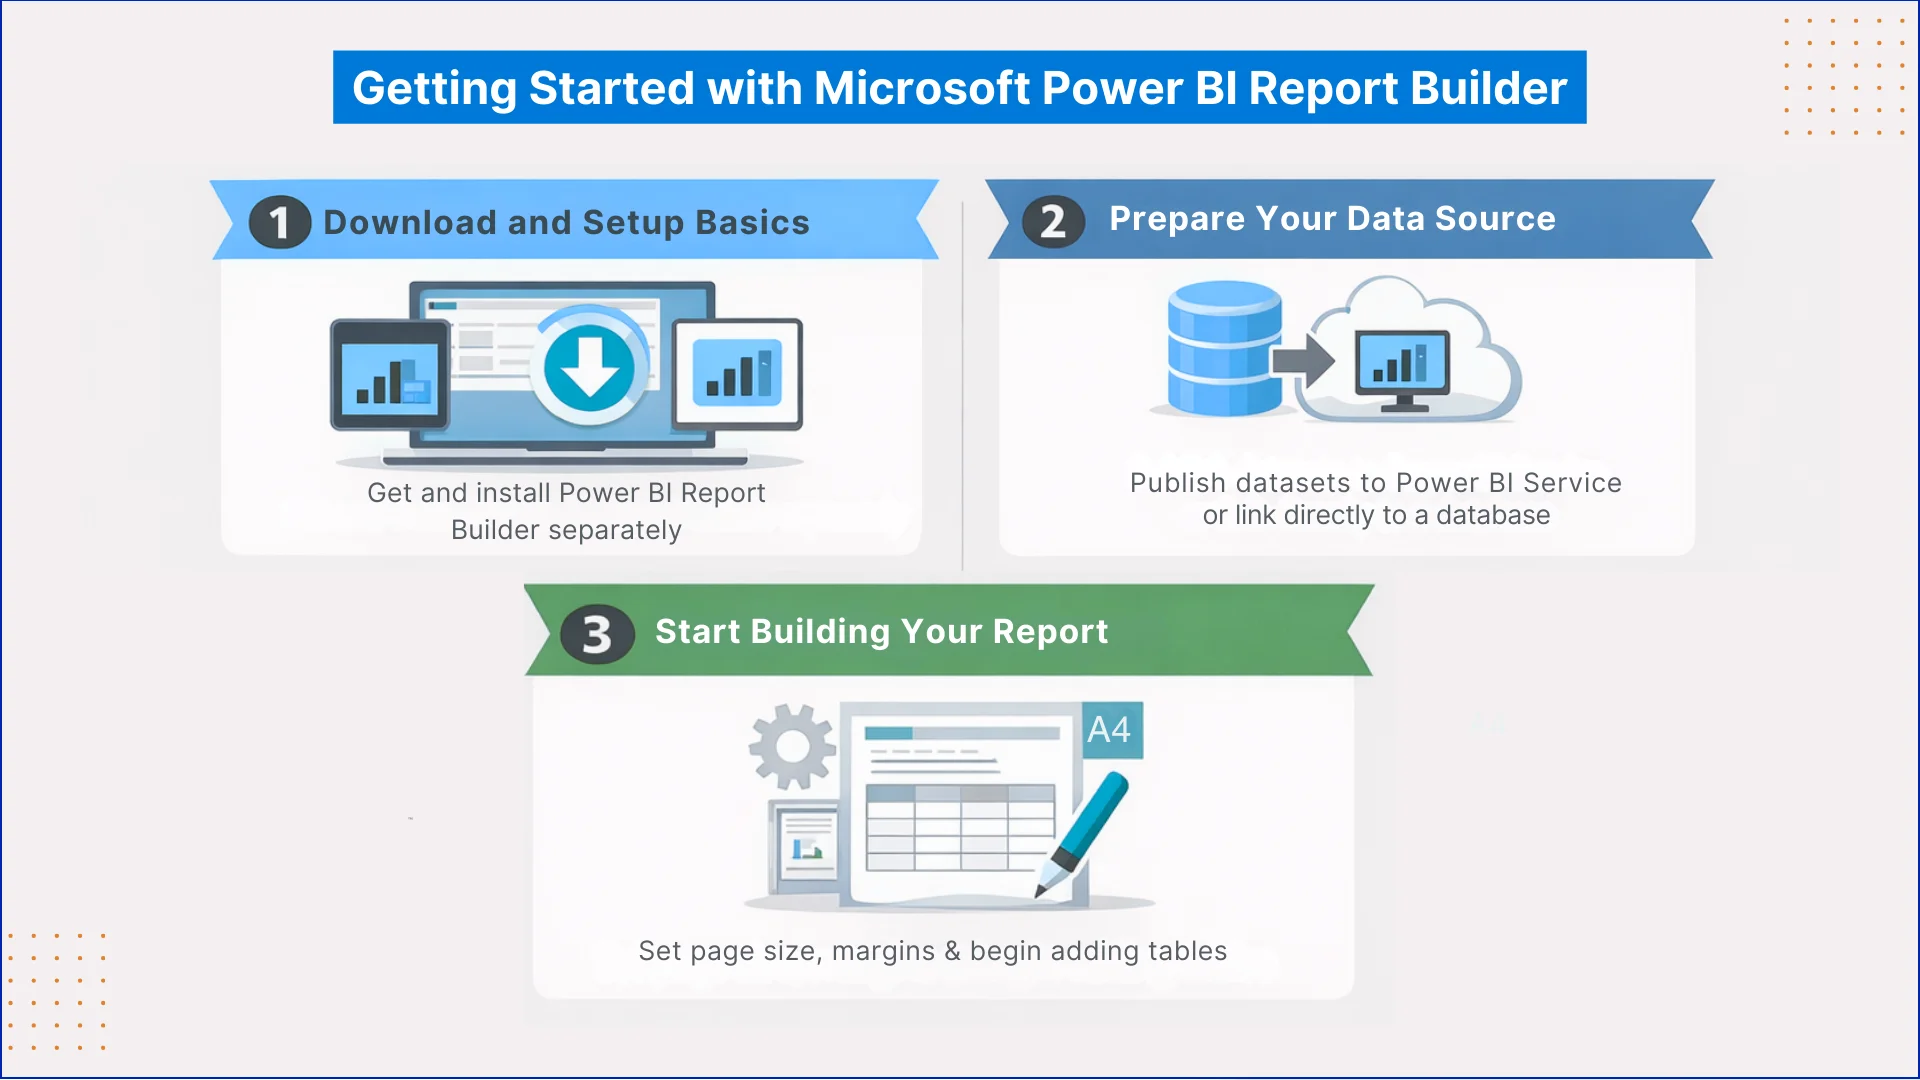
Download and setup basics
Power BI Report Builder is a separate application and is not included with Power BI Desktop. This often surprises beginners. The Power BI Report Builder download must be done separately, and it installs as a standalone tool within the Microsoft Power BI ecosystem.
The interface looks more like a document editor than a visual canvas. This is intentional and aligns with its reporting purpose.
What you need before building a report
Before creating a paginated report, a data source must already be available. This is usually a dataset published to Microsoft Power BI Service or a direct database connection. Business logic should already be finalized, since paginated reports focus on delivery, not exploration.
This is an important concept for Power BI Report Builder for beginners.
How reports are typically created
Report creation starts by connecting to data and defining layout settings such as page size and margins. Tables and groups are then added to structure the report. Planning the layout early is a key part of any step by step Power BI Report Builder guide.
Focusing on structure first makes Power BI Paginated Reports easier to manage and maintain.
Common Beginner Mistakes with Microsoft Power BI Report Builder
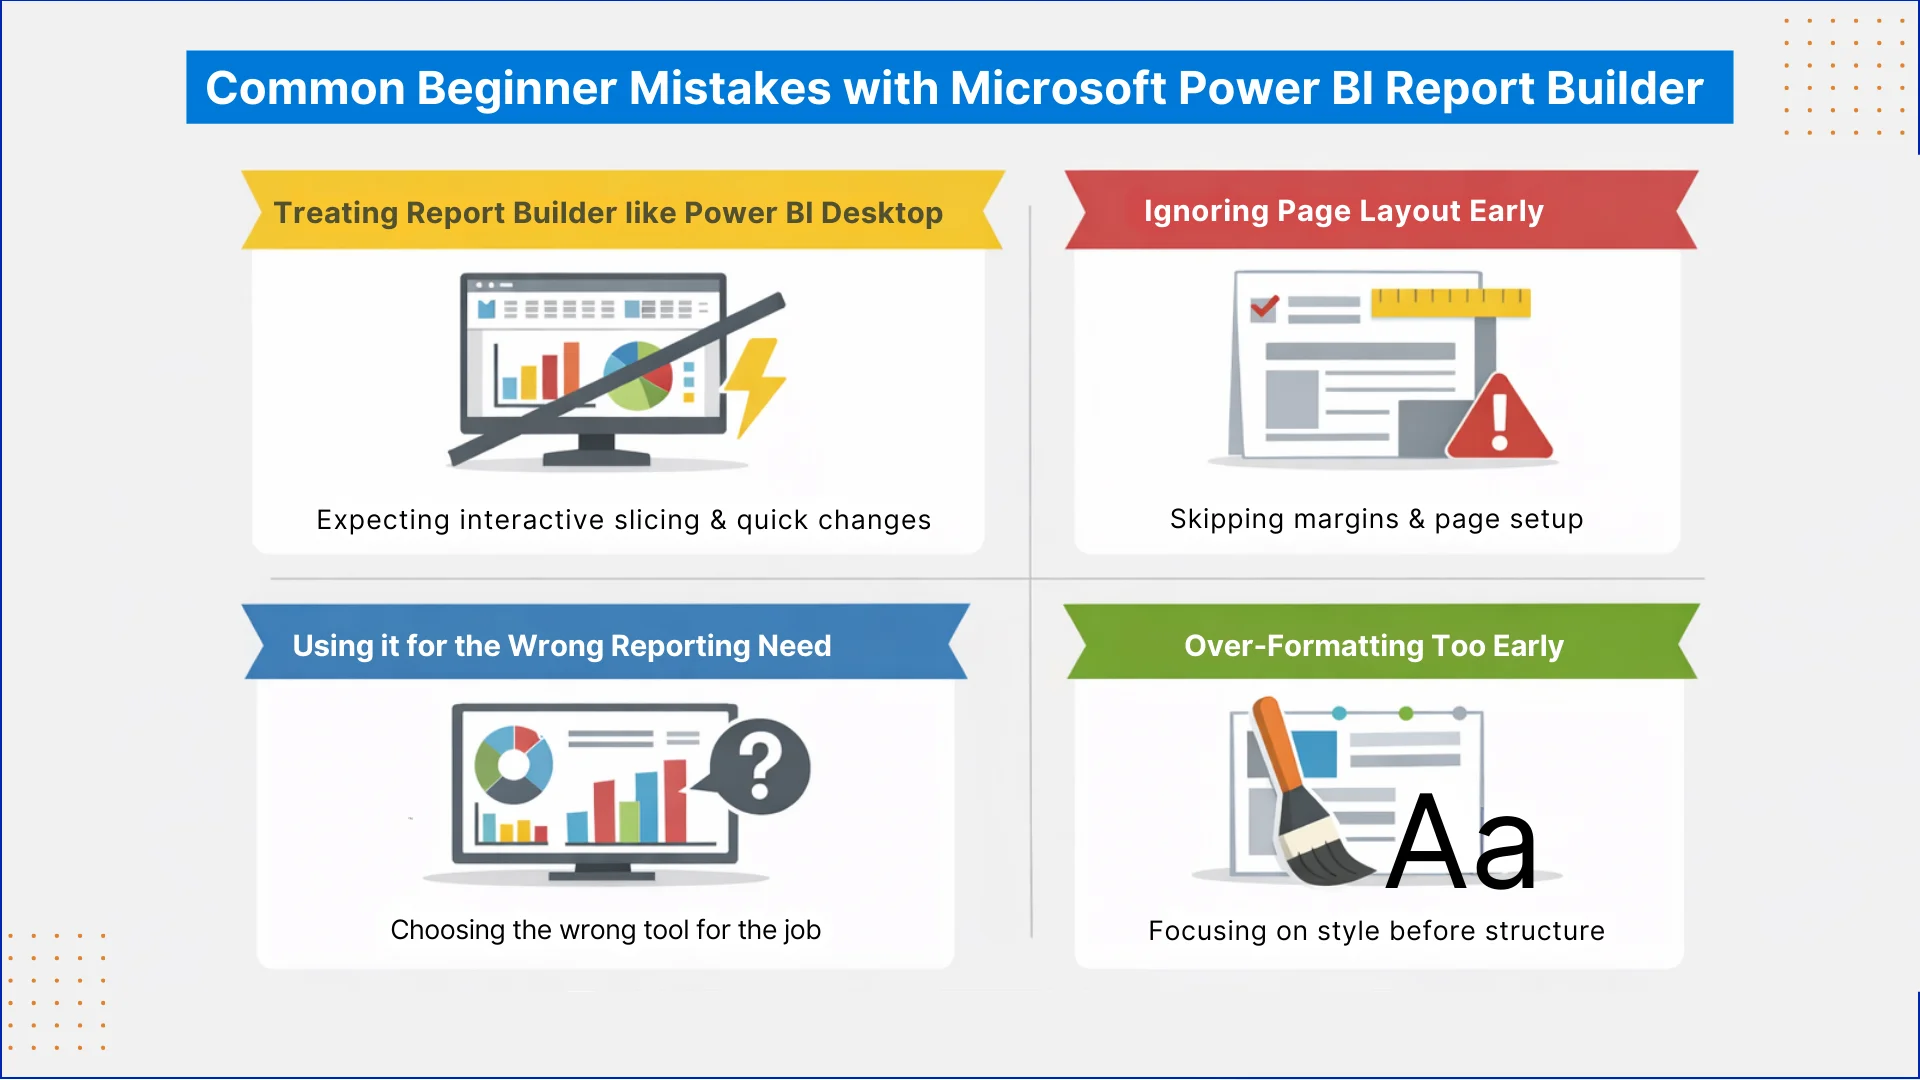
Treating Report Builder like Power BI Desktop
One of the most frequent beginner mistakes is trying to use Power BI Report Builder the same way as Power BI Desktop. Beginners expect interactive slicing, flexible visuals, and quick experimentation. Report Builder is not designed for that. It assumes the data model and logic are already finalized.
This misunderstanding leads to frustration and poorly designed reports.
Ignoring page layout early
In Microsoft Power BI paginated reporting, layout decisions are not optional details. Beginners often start placing tables before defining page size, margins, or orientation. This results in broken exports and awkward page breaks later.
In Power BI Report Builder basics, layout planning should always come first.
Using it for the wrong reporting need
Another common issue is using Report Builder when a standard Power BI report would be more appropriate. If the report is meant for exploration, discussion, or dashboard-style viewing, Report Builder is the wrong tool.
This mistake often happens when users do not understand Power BI vs Report Builder at a decision level.
Over-formatting too early
Beginners often spend too much time on fonts, colors, and styling before the structure is correct. In paginated reports, grouping, pagination, and data flow matter far more than visual polish at the start.
Experienced users of Power BI Report Builder explained focus on structure first and formatting later.
When to Use Microsoft Power BI Report Builder
Power BI Report Builder should be used when the report is meant to be delivered, not explored. It is the right choice when the layout is fixed, the format is approved, and the same report needs to be generated repeatedly without changes.
If the report must print cleanly, export reliably to PDF or Excel, or follow a strict page structure, Power BI Paginated Reports are the correct solution.
Report Builder should not be used when the goal is analysis or discovery. If users need to filter data freely, interact with visuals, or change perspectives during review, standard Power BI reports are a better fit.
A simple rule helps beginners decide. If the report is for reading, use Power BI Report Builder. If the report is for exploring, use Power BI Desktop. This single decision prevents most misuse inside the Microsoft Power BI ecosystem.


Do you have more questions?
Have a one on one discussion with our Expert Panel
Azure Integration Services Explained: Logic Apps, Service Bus, API Management, and Event Grid Rohit Dabra | July 10, 2026 Table of Contents Facebook-f Twitter Linkedin Summarize in: Get an instant AI summary of this article OpenAI Perplexity Claude Introduction Azure Integration Services is Microsoft’s suite
Power BI Embedded is Microsoft’s developer-focused API for embedding interactive analytics directly inside third-party apps, customer portals, and SaaS products. If you are building software and want customers to see live dashboards without logging into the Power BI service, this is where that journey starts. The question is not whether you can embed Power BI reports, you almost certainly can. The real question is whether it makes financial and architectural sense for your specific situation. This guide covers the when, the how, and the cost math that most tutorials skip.
Power apps portals sit at an interesting crossroads for IT leaders: they’re fast, deeply integrated with the Microsoft stack, and manageable without a dedicated development team. But they’re also constrained in ways that matter when your business needs a portal that handles complex UI logic, third-party integrations outside the Microsoft ecosystem, or pixel-perfect UX design.
This guide gives you a straight comparison so you can make the right call without spending three months in discovery. We’ll cover what each option actually delivers, where each breaks down, and the governance questions that need answers before you commit either way.
If you’re evaluating your Microsoft stack more broadly, our breakdown of Power Platform vs Custom .NET Development provides useful parallel context.


Sahil Kataria
Founder and CEO

Amit Kumar
Chief Sales Officer


QServices Inc. undertakes every project with a high degree of professionalism. Their communication style is unmatched and they are always available to resolve issues or just discuss the project.
