


-
Industries
Healthcare & Compliance
Patient data systems, compliance reporting, and workflow automation for regulated environments.
- HIPAA-aware integration pipelines
- Automated compliance dashboards
- Patient workflow digitization
Logistics & Supply Chain
Real-time tracking, route optimization, and inventory visibility across your distribution network.
- ERP/WMS integration
- Automated dispatch workflows
- Supply chain dashboards
SaaS & Tech-enabled
Scale your product infrastructure, integrate third-party tools, and ship features faster with reliable ops.
- API-first architecture
- Multi-tenant infrastructure
- CI/CD and release pipelines
Banking & Financial
Secure transaction processing, regulatory reporting, and customer-facing portals for financial services.
- Regulatory reporting automation
- Secure data integration
- Customer portal modernization
- Case Studies
Featured Case Studies
Browse all case studies →Euro Truck ServiceLogistics firm automated 12 manual workflows in a single 30-day sprint
"Read case study →Ergonnex AI 360Ergonnex AI 360 is a powerful project management platform that helps IT companies manage their projects better with built-in AI-powered analytics
Read case study →PanoramikPanoramic caters to your passion for sharing photos in a social media environment.
Read case study →

Introduction
Every business today depends on data. But using reports from yesterday or last week is no longer enough. Companies need real-time analytics that show what is happening at the moment and help them act fast. This is where Power BI dashboards become essential. They turn live data into clear visuals that make it easier for teams to make quick and smart decisions.
Why old-style reporting no longer works
In the past, business intelligence tools focused on collecting data and creating reports every month. That approach worked when things moved slowly. Now, businesses need to make decisions in seconds. Waiting for static reports can mean missing sales, reacting late to supply issues, or not spotting financial risks on time.
Microsoft Power BI solves this problem. It is one of the most trusted business intelligence tools that allows teams to access real-time data analytics anytime. With Power BI dashboards, information updates automatically so leaders can see what is happening in sales, operations, or finance without delay. Whether it is a power bi operations dashboard showing production activity or a power bi customer dashboard tracking live feedback, teams get the full picture instantly.
How Power BI dashboards improve business speed
The real strength of Microsoft Power BI is how it combines live data with easy data visualization. A business insights dashboard gives managers a quick and complete view of performance without needing to check multiple reports. Leaders can open a real time business dashboard to monitor sales, shipments, or marketing results that refresh in real time.
Retail companies use Power BI dashboards to change prices based on live sales results. Financial departments depend on Power BI reporting solutions to track cash flow instantly. Operations managers use Power BI live data monitoring to detect delivery delays as soon as they occur. These examples highlight the benefits of Power BI for real-time data analysis and how it helps organizations move faster and smarter.
By learning how to use Power BI for real-time business insights, companies shift from slow manual reporting to constant awareness. Power BI dashboards for business performance tracking give live updates on sales, customer engagement, and operations. With Power BI data streaming for business insights, new data keeps flowing every second, helping teams stay informed and confident.
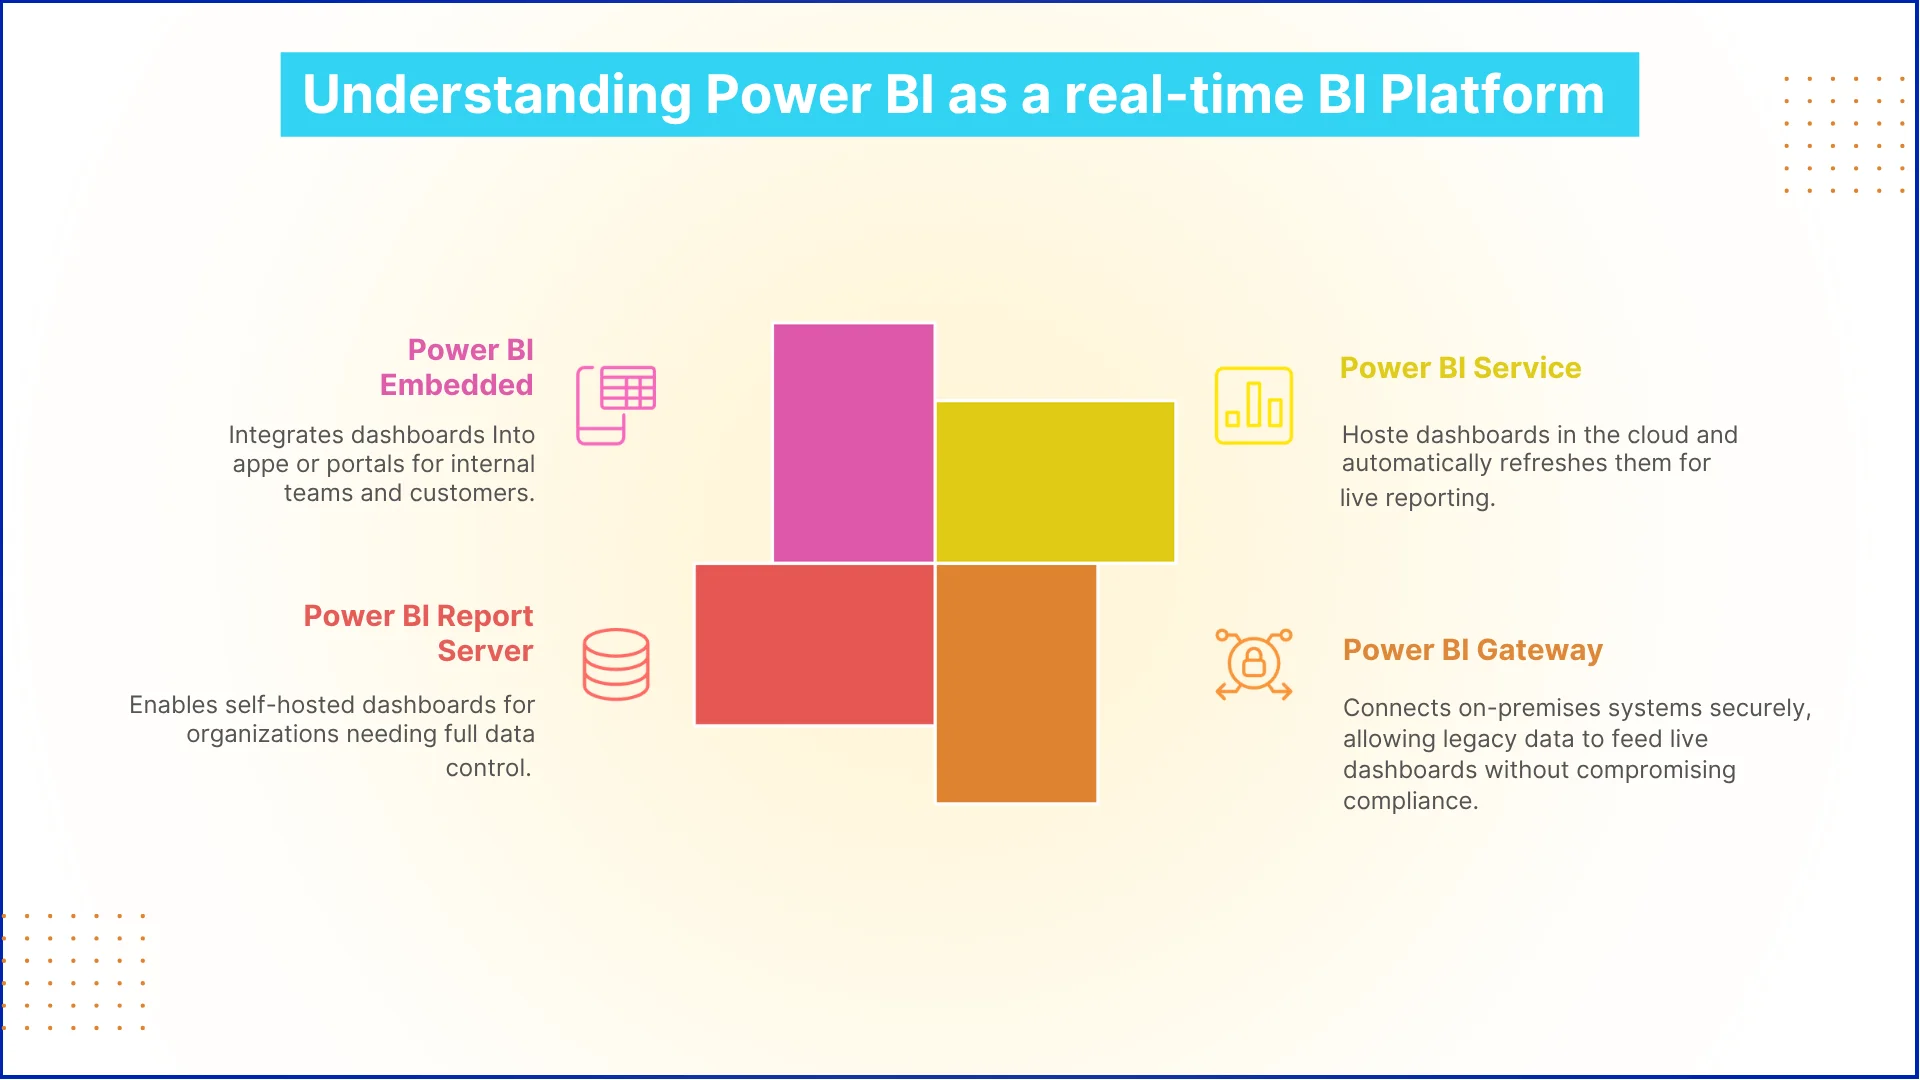
Understanding Power BI as a real-time BI Platform
When enterprises consider real-time analytics, the first question is often: “How complex and costly will this be?” Surprisingly, Microsoft Power BI is designed to simplify live insights while supporting enterprise-scale operations securely. To understand the real value of Power BI dashboards, it is important to look at both its architecture and real-world integration.
What makes Power BI’s real-time architecture unique?
So, how does Power BI ensure continuous, reliable data flow across different environments? The answer lies in its layered design.
- Power BI Service hosts dashboards in the cloud and automatically refreshes them for live reporting.
- Power BI Gateway connects on-premises systems securely, allowing legacy data to feed live dashboards without compromising compliance.
- Power BI Report Server enables self-hosted dashboards for organizations needing full data control.
- Power BI Embedded integrates dashboards into apps or portals for internal teams and customers.
This layered architecture allows enterprises to unify multiple data streams into a single, reliable business insights dashboard, turning scattered data into actionable intelligence.
How does data flow for real-time insight
Another key question is: Which methods power live data in enterprise dashboards?
Organizations leverage multiple methods:
- Streaming datasets for event-driven updates
- DirectQuery for near-live queries
- Push APIs for instant delivery
For example, a telecom company or IoT provider can push millions of events per minute from Azure Event Hub into Power BI dashboards, enabling true real-time data analytics. A global manufacturer uses this in their bi dashboard solution to detect production anomalies instantly, cutting downtime by over 30%. Similarly, a retail chain monitors POS terminals in real time and adjusts promotions based on live sales, demonstrating the operational power of Power BI live data monitoring.
What business value does real-Time reporting deliver?
Research shows that organizations leveraging Power BI for real-time data analysis achieve up to 25% faster decision-making and 20% lower operational risks.
Consider a logistics company using a Power BI operations dashboard to track shipments. Proactive alerts to clients reduce delays and improve satisfaction. A financial services firm can detect transaction anomalies instantly using Power BI reporting solutions, preventing fraud and ensuring compliance. These examples show that Power BI dashboards are operational tools that drive measurable value.
How are Power BI Dashboards evolving?
Experts note that BI dashboarding is shifting from visual appeal to predictive foresight and alignment across teams. Shared live datasets allow tailored business insights dashboards that synchronize sales forecasts, supply chain updates, and financial KPIs. This interconnected visibility accelerates enterprise agility, transforming Power BI dashboards for business performance tracking into nerve centers of real-time decision-making.
Building a real-time analytics workflow in Power BI
How can businesses make live data actually drive decisions instead of just filling dashboards?” This is the challenge real-time Power BI dashboards solve. Designing a workflow that connects multiple live streams into a single, reliable dashboard is what separates insightful analytics from generic reporting.
How does data streaming power decision-making?
At the heart of any real-time dashboard is Power BI data streaming for business insights. Streaming datasets pull live feeds from IoT sensors, CRM systems, transactional databases, and even social media.
- In logistics, Azure Event Hubs streams telemetry into Power BI live dashboards for executive decision-making, allowing managers to spot shipment delays early and reduce delivery disruptions by 15–20%.
- Retailers track point-of-sale data, inventory, and online orders in near real-time to adjust promotions dynamically, turning Power BI dashboards for business performance tracking into revenue-driving tools.
Power BI offers three main streaming mechanisms: push datasets, streaming datasets, and DirectQuery. Each serves a different need—whether immediate event-driven updates or near-live querying—helping enterprises balance speed, volume, and accuracy.
What makes a dashboard perform well at scale?
Streaming data alone isn’t enough. Executives often ask: “How can we ensure our dashboards remain responsive and actionable?”
Experts recommend:
- Incremental refresh policies in Power BI reporting solutions to reduce load.
- Pre-aggregated tables for faster tile rendering.
- Conditional formatting and dynamic filtering in Power BI data visualization to highlight anomalies immediately.
- Continuous monitoring using Power BI live data monitoring tools or Azure Monitor.
For instance, a global manufacturer integrated sensor data with quality metrics into a Power BI operations dashboard. Dashboards refreshed every minute, enabling managers to act proactively and reduce defects by 12%.
How do enterprises combine multiple streams into unified insights?
Modern organizations collect data from ERP, CRM, APIs, and external web services. Central orchestration ensures all streams feed a unified business insights dashboard, enabling teams to work from a single source of truth. Tools like Power BI Dataflows and Azure Data Factory harmonize and transform these streams, ensuring consistency across sales, finance, and operations.
A financial services firm, for example, monitors cash flow anomalies alongside live sales data on shared dashboards, improving forecasting and allowing faster informed decision-making.
Power BI is a real-time intelligence hub where insights flow directly into actions, whether adjusting promotions, rerouting shipments, or detecting operational risks. By connecting multiple data streams and applying best practices, Power BI dashboards deliver immediate, measurable business value.
Designing real-time dashboards that drive action
In most enterprises, dashboards sit unused because they don’t tell a story. Power BI dashboards, when designed right, do far more than visualize data—they guide decisions, align teams, and highlight opportunities the moment they arise. The dashboards that make an impact share a common thread: they translate real-time data into immediate action without overwhelming the user.
Turning operational chaos into clarity
A logistics company faced challenges with shipment delays because operations teams only got updates every few hours. After implementing a Power BI operations dashboard fed by live telemetry from Azure Event Hubs, managers could see delays as they happened and reroute shipments proactively. Within weeks, they cut delivery disruptions by nearly 20%. That’s the kind of impact real-time dashboards deliver when the design matches the business need.
Customer-centric dashboards that drive revenue
A mid-sized retail chain combined POS, e-commerce, and CRM data into a Power BI customer dashboard. Marketing teams could see which promotions resonated in near real-time, adjust offers on the fly, and respond to inventory changes instantly. Revenue optimization happened daily, guided by a dashboard built for action, not just observation.
Collaboration and unified insights
Dashboards become exponentially more valuable when shared across teams. Embedding them into Teams, SharePoint, or custom apps ensures sales, finance, and operations teams see the same live story. Everyone can act in sync, whether adjusting a promotion, rerouting shipments, or reallocating resources. This is why we call Power BI dashboards for business performance tracking the nerve centers of modern enterprises, as they don’t just show data but drive coordinated action.
Predictive and AI-enhanced dashboards
Looking ahead, dashboards are evolving. Predictive insights, AI integration, and Power BI dashboards for predictive and real-time analytics help you anticipate what’s next. For businesses, that’s where real competitive advantage lives: turning live data into foresight that informs decisions before opportunities or risks fully materialize.

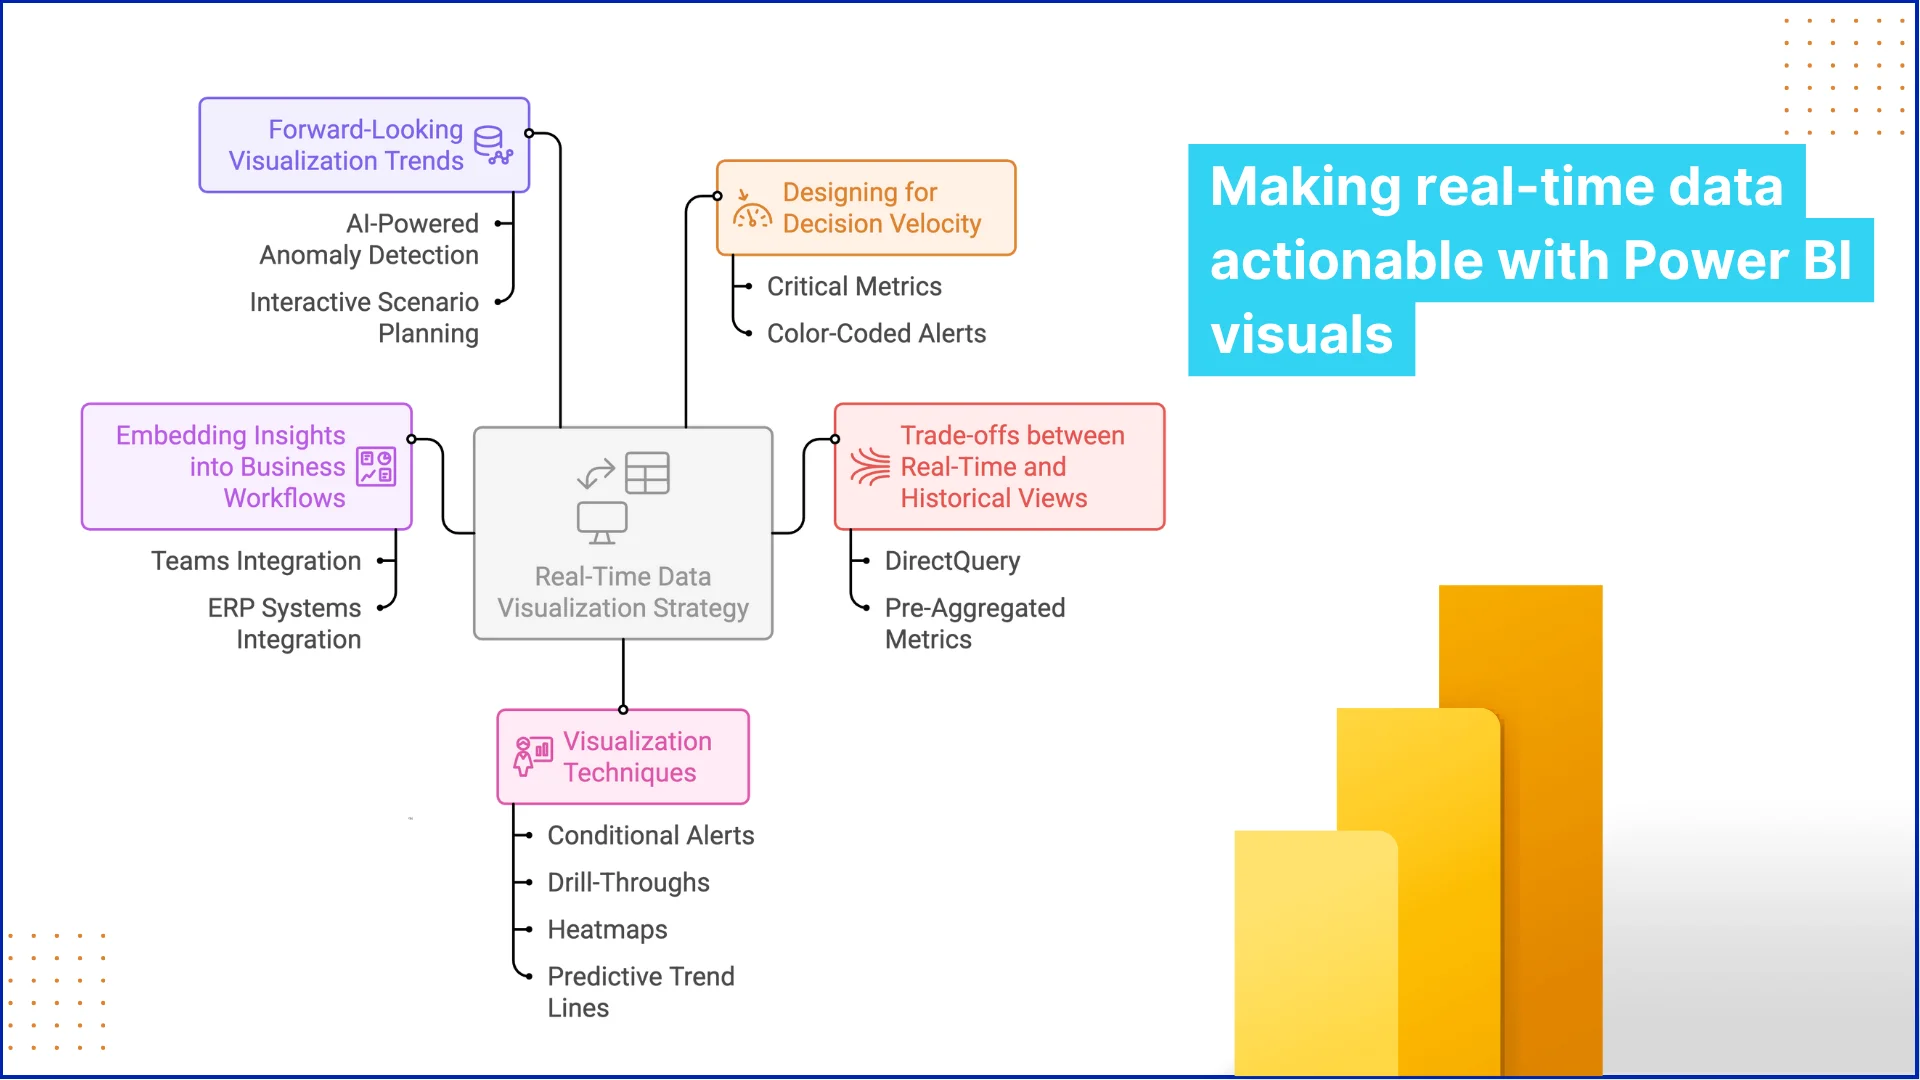
Making real-time data actionable with Power BI visuals
 Why does the visualization strategy matters for real-time decisions? It’s not enough to stream data live; executives need to act within seconds, not hours. Poor visualization can hide critical anomalies or mislead decisions. A common mistake in enterprises is cluttering dashboards with too many charts, creating noise instead of insight. Expert-level dashboarding focuses on highlighting decision-critical metrics, prioritizing speed of comprehension over aesthetics.
Designing for decision velocity
High-value dashboards answer one question for each user: “What do I need to do now?” In manufacturing, for example, displaying all sensor data in raw form overwhelms teams. A Power BI operations dashboard that aggregates critical temperature, pressure, and downtime metrics with color-coded alerts allows managers to act before minor issues become production stoppages. Companies adopting this approach have reduced downtime by 12–15% on average.Trade-offs between real-time and historical views
An expert consideration is balancing live streaming vs. historical context. Executives need trend awareness while operational teams need immediate alerts. Using DirectQuery for near-live insights combined with pre-aggregated historical metrics ensures dashboards stay responsive without sacrificing analytical depth.Visualization techniques that actually work in enterprise settings
- Conditional alerts tied to KPIs: Immediate visual cues for anomalies.
- Drill-throughs and linked dashboards: Let users explore data without losing context.
- Heatmaps and geospatial overlays: Show operational bottlenecks in logistics or retail foot traffic patterns.
- Predictive trend lines: Combine live data with forecasting to anticipate issues before they occur.
Embedding insights into business workflows
Expert-level dashboards don’t live in isolation. Embedding Power BI dashboards into Teams or ERP systems aligns action with insight. Finance teams can approve transactions, operations can reroute shipments, and marketing can launch campaigns, all from the same live view, reducing decision lag from hours to minutes.Forward-looking visualization trends
The next wave of real-time visualization involves AI-powered anomaly detection and interactive scenario planning. Dashboards evolve from reporting tools into predictive decision hubs. Companies integrating AI into Power BI dashboards for predictive and real-time analytics can forecast supply chain disruptions or detect early financial anomalies, turning live data into strategic foresight.Turning real-time insights into high-impact decisions
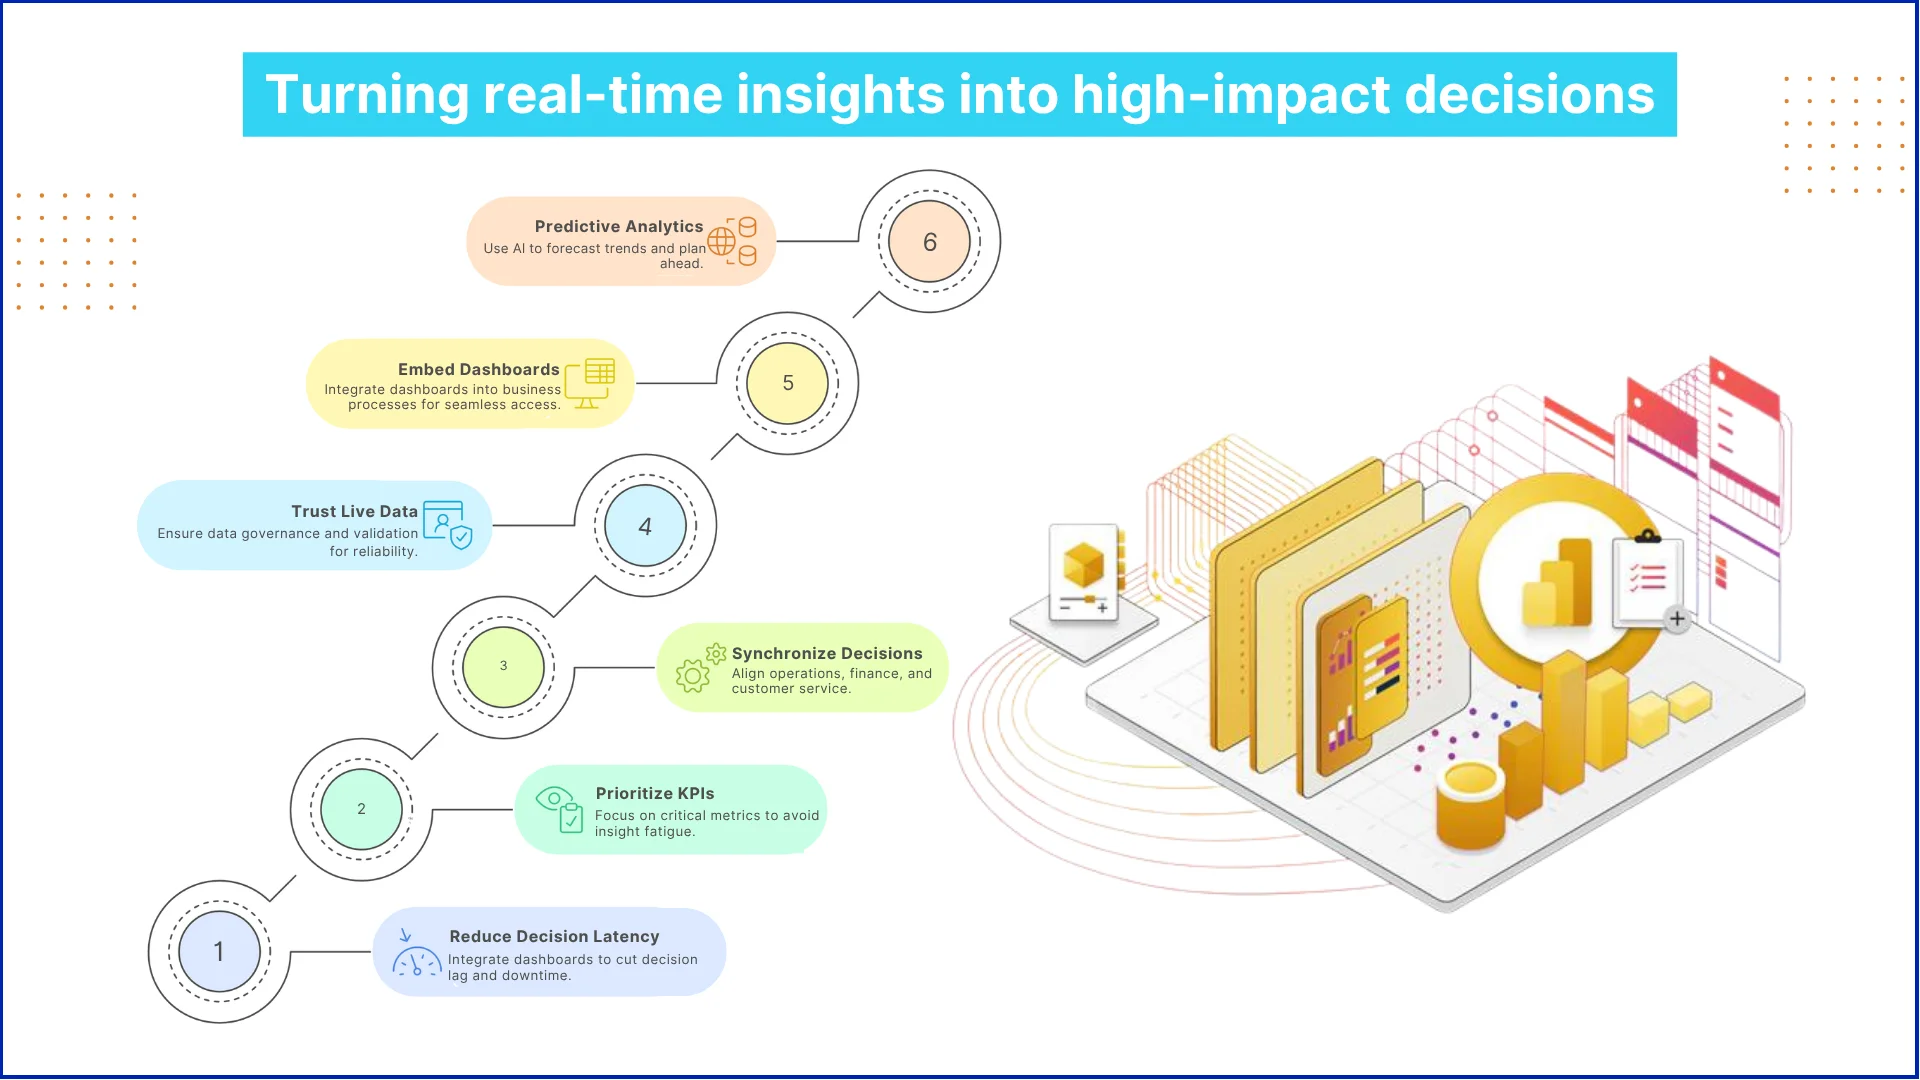
Decision latency is the hidden cost
Many organizations underestimate the cost of delayed decisions. In a global manufacturing enterprise, waiting hours for batch reports meant minor production issues escalated into line stoppages, causing 5–7% monthly revenue loss. By integrating Power BI dashboards into operational workflows, the company reduced decision lag from hours to minutes, cutting costly downtime and enabling proactive problem-solving.Where dashboards often fail executives
Even with live dashboards, executives often face “insight fatigue.” Too many metrics, redundant visuals, or conflicting sources can lead to inaction. An expert approach is to prioritize decision-critical KPIs, map them to specific business outcomes, and design dashboards as decision triggers, not just reporting tools.Synchronizing cross-functional decisions
High-value real-time analytics is about alignment. Operations, finance, and customer service need to act in concert. A logistics firm leveraged Power BI operations dashboards combined with predictive alerts. Operations rerouted shipments instantly, finance adjusted cost projections, and customer service proactively notified clients. The result? On-time delivery improved by 18%, and cost overruns dropped by 12%.Trusting live data for high-stakes decisions
Executives often ask: Which live insights can I trust for critical actions? Ensuring data governance and validation is essential. Integrating Power BI with controlled dataflows, streaming datasets, and live monitoring ensures every decision stems from verified, actionable information, minimizing risk while accelerating response time.Embedding dashboards into business processes
The most effective organizations don’t treat dashboards as passive tools. Embedding Power BI dashboards for business performance tracking into Teams, ERP, and CRM systems means decisions happen where work actually occurs. Procurement, production, sales, and finance teams act from the same live dataset.Predictive and real-time analytics with Power BI and AI
Most companies only respond after events happen. Combining predictive analytics with live data changes that. By adding AI models into Power BI dashboards, decision-makers can forecast trends, spot issues early, and plan ahead. Example: A retail chain predicts stock shortages using live sales data and AI forecasts. Stores can restock before shelves are empty, cutting lost sales by up to 10%.How predictive insights work with live dashboards
Power BI works with Azure ML, Python, R, and AI Copilot to bring predictive models directly into dashboards. Streaming datasets feed real-time data to models, giving insights such as:- Forecasting future sales, demand, or operational load.
- Spotting anomalies in equipment, transactions, or customer activity.
- Running “what-if” scenarios to test decisions instantly.
Impact on operations and finance
Manufacturers using Power BI operations dashboards with predictive models can see potential equipment failures before they happen, saving millions and avoiding downtime. Financial firms detect unusual transactions in real time, preventing fraud and staying compliant.Practical tips for AI in Power BI dashboards
1. Focus on key metrics: Predictions are most useful when tied to revenue, cost, or risk. 2. Combine past and current data: Models work best with full context. 3. Check predictions regularly: Conditions change, so models need validation. 4. Show confidence levels: Teams need to know how reliable predictions are before acting. Dashboards are moving beyond reporting—they are becoming real-time decision hubs. With AI and live data, executives can not only track performance but anticipate challenges, optimize strategies, and make faster, smarter decisions.Industry use cases of real-time Power BI dashboards
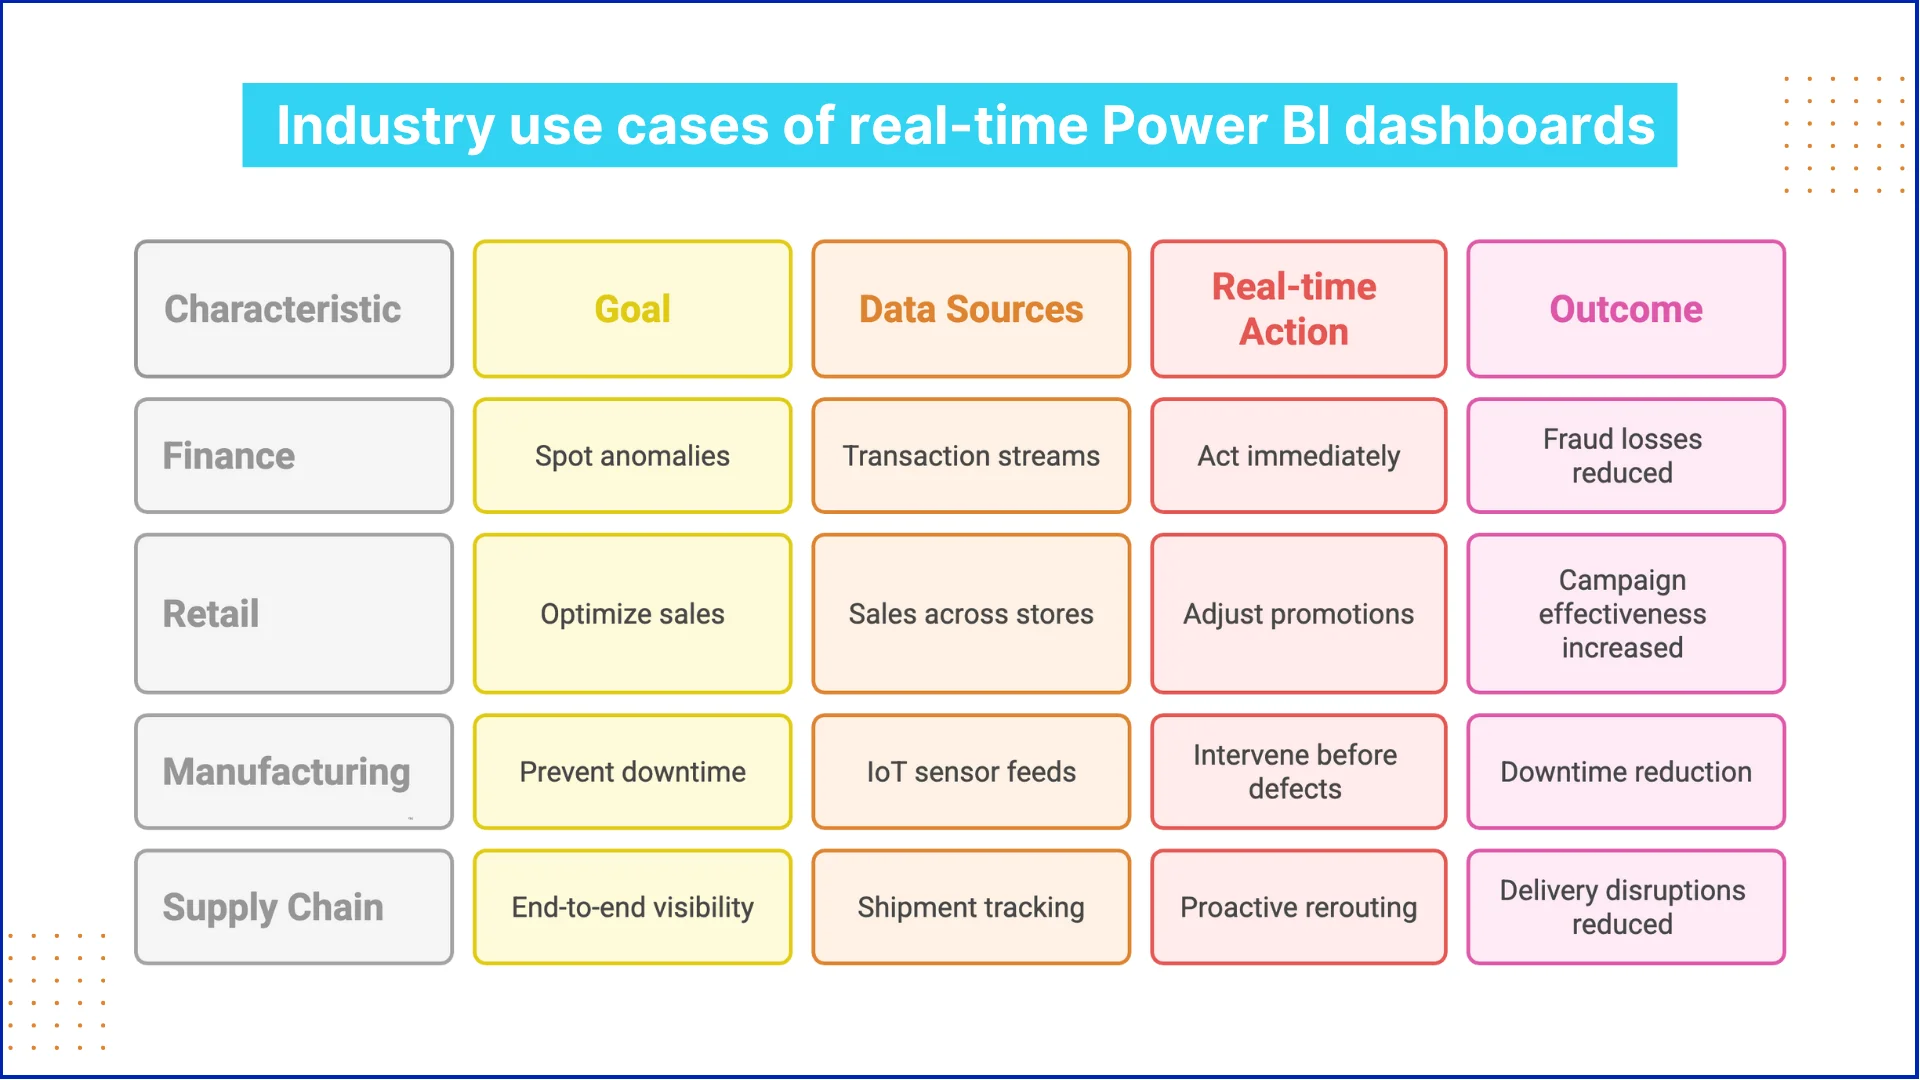
Finance: spotting anomalies before they escalate
Financial firms face constant pressure to detect fraud, monitor compliance, and track risk. Using Power BI dashboards for business performance tracking, a multinational bank integrated transaction streams with predictive models. Suspicious activity is flagged in real time, allowing compliance teams to act immediately. The outcome: fraud losses reduced by 15%, while reporting time dropped from days to minutes.Retail: optimizing sales and inventory on the fly
Retail chains deal with fluctuating demand and inventory challenges. A global retailer used Power BI for business insights to monitor sales across hundreds of stores. Live dashboards highlighted stock shortages, regional sales spikes, and promotion performance. Managers adjusted store-level promotions in real time, increasing campaign effectiveness by 10–12% and reducing overstock costs.Manufacturing: preventing downtime and defects
Production lines cannot afford unexpected stoppages. A manufacturer integrated IoT sensor feeds into a Power BI for manufacturing dashboards solution. By tracking equipment health, quality metrics, and output in real time, managers could intervene before defects occurred. The result: a 12–15% reduction in downtime and cost savings on rework.Supply chain: visibility from end to end
Supply chains are complex, and delays ripple across operations. A logistics provider implemented Power BI in supply chain analytics, combining shipment tracking, warehouse data, and external transportation feeds. Real-time insights allowed proactive rerouting, reducing delivery disruptions by 18–20% and improving customer satisfaction.

Do you have more questions?
Have a one on one discussion with our Expert Panel
Azure Integration Services Explained: Logic Apps, Service Bus, API Management, and Event Grid Rohit Dabra | July 10, 2026 Table of Contents Facebook-f Twitter Linkedin Summarize in: Get an instant AI summary of this article OpenAI Perplexity Claude Introduction Azure Integration Services is Microsoft’s suite
Power BI Embedded is Microsoft’s developer-focused API for embedding interactive analytics directly inside third-party apps, customer portals, and SaaS products. If you are building software and want customers to see live dashboards without logging into the Power BI service, this is where that journey starts. The question is not whether you can embed Power BI reports, you almost certainly can. The real question is whether it makes financial and architectural sense for your specific situation. This guide covers the when, the how, and the cost math that most tutorials skip.
Power apps portals sit at an interesting crossroads for IT leaders: they’re fast, deeply integrated with the Microsoft stack, and manageable without a dedicated development team. But they’re also constrained in ways that matter when your business needs a portal that handles complex UI logic, third-party integrations outside the Microsoft ecosystem, or pixel-perfect UX design.
This guide gives you a straight comparison so you can make the right call without spending three months in discovery. We’ll cover what each option actually delivers, where each breaks down, and the governance questions that need answers before you commit either way.
If you’re evaluating your Microsoft stack more broadly, our breakdown of Power Platform vs Custom .NET Development provides useful parallel context.


Sahil Kataria
Founder and CEO

Amit Kumar
Chief Sales Officer


QServices Inc. undertakes every project with a high degree of professionalism. Their communication style is unmatched and they are always available to resolve issues or just discuss the project.
